Ethereum (ETH/USD) Market Hits Resistance at $4,000
Estimated Reading Time: 3 minutes
Don’t invest unless you’re prepared to lose all the money you invest. This is a high-risk investment and you are unlikely to be protected if something goes wrong. Take 2 minutes to learn more
Ethereum Price Prediction – October 18
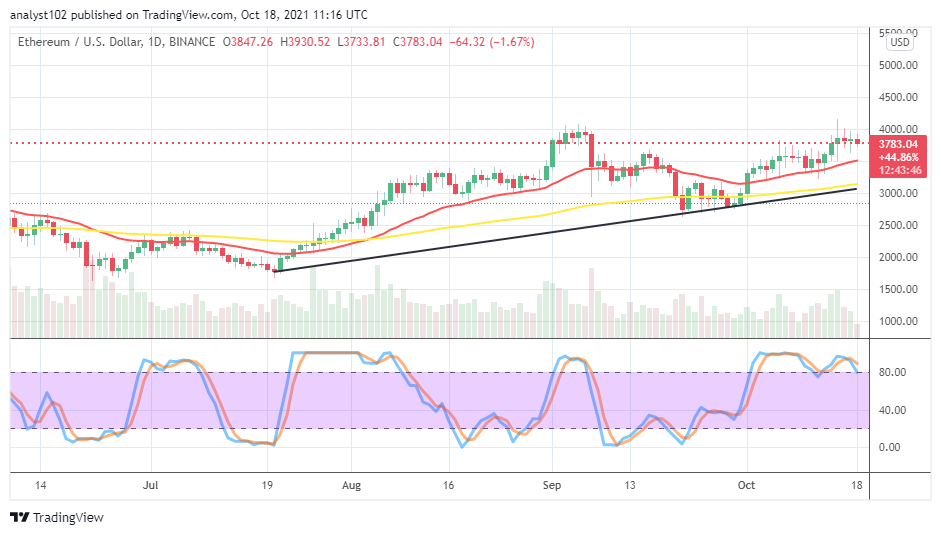
It recorded that the ETH/USD market hits resistance at $4,000 as in the manner during the operations between September 3rd and 7th trading days’ sessions. The crypto’s price trades around $3,783 at a percentage rate of about -1.67. That signifies that the market has somewhat witnessed some degrees of depressions in the last couple of trading hours.
ETH/USD Market
Key Levels:
Resistance levels: $4,000, $4,250, $4,500
Support levels: $3,500, $3,250, $3,000
ETH/USD – Daily Chart
The ETH/USD daily chart has revealed that the crypto market hits resistance at the $4,000 level. There has been featuring series of erratic candlesticks representing the trade activities around $3,500 and $4,000 in a bullish outlook. The 14-day SMA trend line is over the 50-day SMA trend line as the bullish trend line drew alongside the bigger indicator in a supportive posture around $3,000. The Stochastic Oscillators are in the overbought region swinging around. And they have briefly crossed the lines southbound to touch the range of 80. That could mean that the market may witness a degree of reductions in its valuation soon.
Should traders still be on the lookout for more possible ups as the ETH/USD market hits resistance at $4,000?
It needed to note that the ETH/USD trading activities are majorly featuring around the levels of $3,500 and $4,000 as the crypto-economic market hit resistance at the latter value line. As a result, it would be highly technical ideal that traders intending to long on this market to allow some amounts of price retracements to occur coupling with a rebound at a lower zone before considering a buy order. A sudden breakdown against the former market point mentioned in no time may invalidate wrong long entry positionings.
On the downside, likely, breaking out at the $4,000 level may not be achieved in the near time sessions as the market tends to hold around the point, featuring fake upside motions that the ETH/USD market bears will be able to launch on. A sudden slippage of price from above the market worth-line may cause free fall-offs, running into few days before exhaustion. While that assumption takes place, investors may expose to panic selling pressures that are not needed.
ETH/BTC Price Analysis
In comparison, the Ethereum market trending capability against that of Bitcoin is under pressure. It means that the base crypto is yet to regain its momentum against the counter-trading instrument. The 14-day SMA indicator has briefly intercepted the 50-day SMA indicator from the top as variant trading candlesticks appear beneath them. That indicates that BTC is gaining stances more than ETH. The Stochastic Oscillators have moved from the oversold region briefly past the range of 40, now trying to cross the lines back southbound around the range value line. It appears that the flagship counter crypto will still trend higher as paired with the base trading tool.
Note: Cryptosignals.org is not a financial advisor. Do your research before investing your funds in any financial asset or presented product or event. We are not responsible for your investing results.
You can purchase crypto coins here. Buy Tokens