Ethereum (Eth/USD) Market Is Attempting to Run Into a Correction
Estimated Reading Time: 3 minutes
Don’t invest unless you’re prepared to lose all the money you invest. This is a high-risk investment and you are unlikely to be protected if something goes wrong. Take 2 minutes to learn more

Free Crypto Signals Channel
Ethereum Price Prediction – July 11
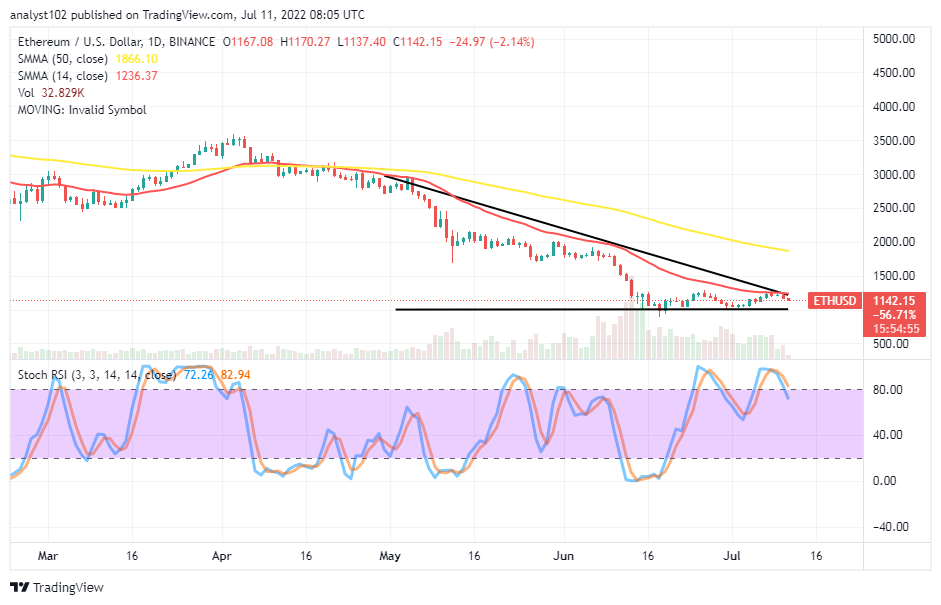
The ETH/USD market is attempting to run into a correction after failing to push higher past the $1250 resistance point. Price has recorded a high of $1,170 and a low of $1.137 at a percentage rate of 2.14 negative.
ETH/USD Market
Key Levels:
Resistance levels: $1,250, $1,500, $1,750
Support levels: $1,000, $800, $600
ETH/USD – Daily Chart
The ETH/USD daily chart reveals the crypto-economic market is attempting to run into a correction from the trend line of the smaller SMA. The 14-day SMA indicator is underneath the 50-day SMA indicator. There is a space separating the two SMAs. The Stochastic Oscillators have crossed southbound from the overbought region. And they have briefly breached past the range of 80 to the downside.
Will the ETH/USD market lose momentum underneath the $1,250 resistance level for a long?
The ETH/USD market activity tends to lose momentum underneath the $1,250 resistance level for a while based on the reading of the Stochastic Oscillators as of writing. It is that the crypto market is attempting to run into a correction. Long-position takers are to suspend actions for a while. Price may have to allow finding support around the $1,000 or a bit below to see if there will be a bullish candlestick to signify a return of upswing worthy of leveraging.
On the downside of the technical analysis, the $1,250 resistance level has to hold firmly above the subsequent operations for a long time. The forces driving the market to the downside may gradually feature in a lighter mode. Bears still prevail over the bulls’ expense of losing energy to push for a recovery. A breakdown at the $1,000 support level will bring the market to a low value of between $800 and $700 afterward.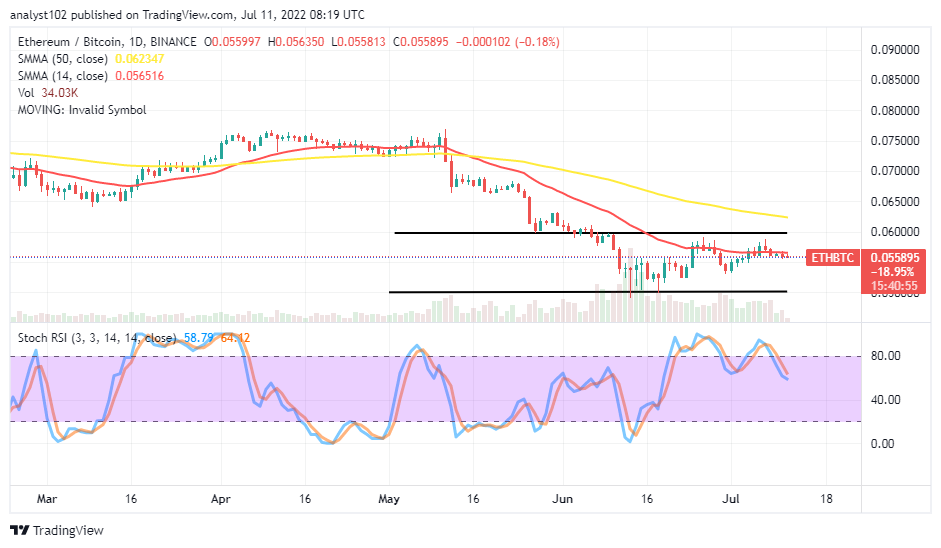
ETH/BTC Price Analysis
Ethereum has been pushing against the trending capacity of Bitcoin around the trend line of the smaller SMA. The 14-day SMA indicator is underneath the 50-day SMA indicator. The horizontal lines are drawn at psychological resistance and support levels as the 14-day SMA are between them. The Stochastic Oscillators are swinging in the overbought region and around the 80 range to signify the cryptocurrency pair market is moving sideways. The base crypto may still go down against the flagship counter crypto.
Note: Cryptosignals.org is not a financial advisor. Do your research before investing your funds in any financial asset or presented product or event. We are not responsible for your investing results.
“Lucky is up more than 50% today but still more than 430% from All Time Highs!
The opportunity to bank BIG is now!
You can purchase Lucky Block here. Buy LBlock