Ethereum (ETH/USD) Market Pushes Northward Toward $1,700
Estimated Reading Time: 3 minutes
Don’t invest unless you’re prepared to lose all the money you invest. This is a high-risk investment and you are unlikely to be protected if something goes wrong. Take 2 minutes to learn more

Free Crypto Signals Channel
Ethereum Price Prediction – August 8
The ETH/USD market operation pushes northward toward $1,700 resistance line. Price has witnessed a high of $1,698 and a low of $1,669 at an average percentage rate of 0.25 negative.
ETH/USD Market
Key Levels:
Resistance levels: $1,750, $2,000, $2,250
Support levels: $1,500, $1,250, $1,000
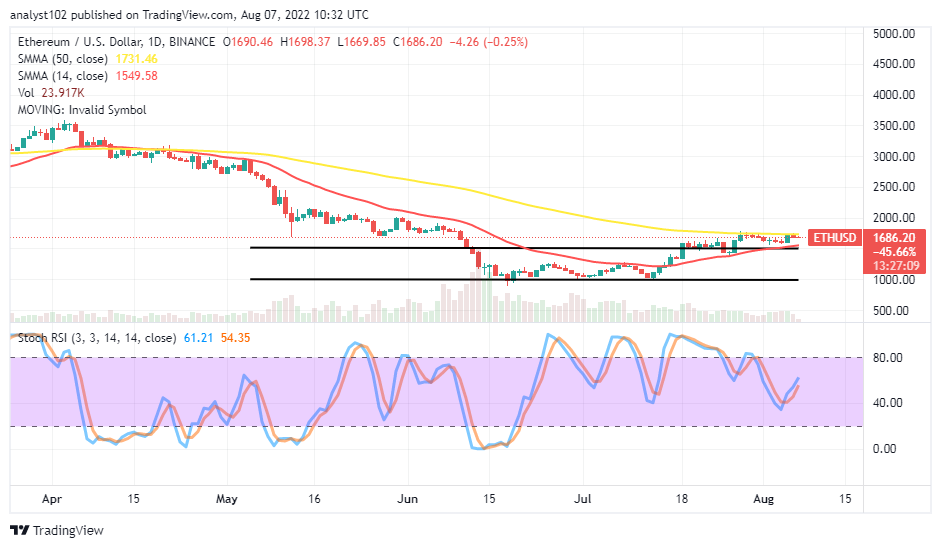
ETH/USD – Daily Chart
The ETH/USD daily chart reveals the crypto-economic market pushes northward toward $1,7000, maintaining a high force to the upside around the trend line of the bigger SMA. The 50-day SMA trading indicator is at $1,731.46 above the $1,539.58 value line of the 14-day SMA indicator. The upper horizontal line drew at the $1,500 support level in an anticipatory mode that the price may fall back into the range-bound spots again. The Stochastic Oscillators have somewhat swerved southbound to get a cross northbound from the range of 40. But, they are seemingly trying close the lines around the range of 60 to indicate a pit stop may play out for a while.
What is the general technical overview of the ETH/USD market outlook?
The general technical overview of the ETH/USD market suggests that the price may encounter resistance resistances around the trend line of the 50-day SMA soon as the crypto economy pushes northward toward the $1,700 level. Long-position placers needed to claim some of their profits before a significant bearish candlestick surface. That means it would be a high risk if new buying positions have to execute at the moment.
On the downside of the technical analysis, the ETH/USD market bears may now have to brace up to spot active rejections of price action around the market value of the 50-day SMA at $1,731.46 or a bit lesser before considering selling orders. The market may slowly and steadily decline to test support around the $1,500 before swinging upward if the value line meant not to be forcefully breached southward in the process of that assumption materializing afterward.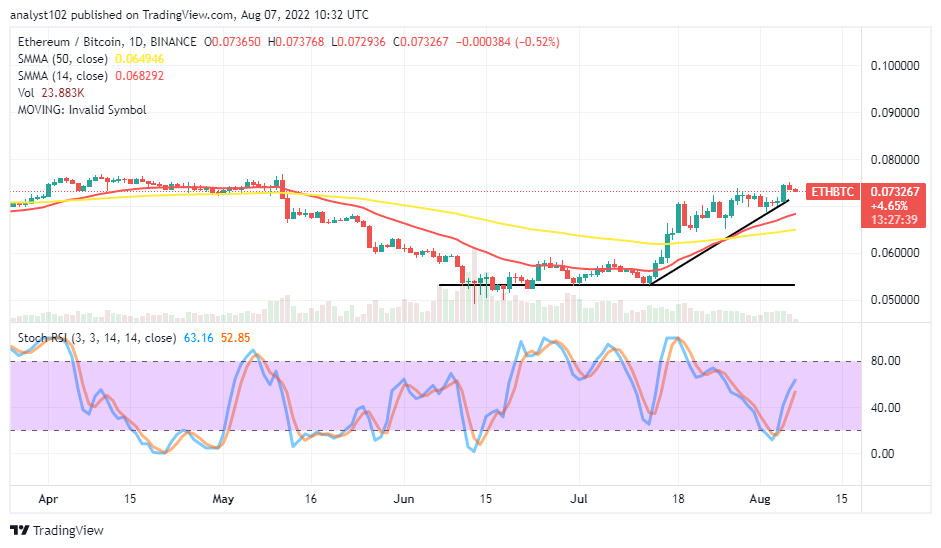
ETH/BTC Price Analysis
Ethereum, as been compared with the pushing weight of Bitcoin in the business environs of crypto economies, has maintained a reasonably high degree of capacity against its counter-trading instrument. In other words, the cryptocurrency pair price pushes northward toward some resistances above the trend lines of the SMAs. The 14-day SMA indicator has intercepted the 50-day SMA indicator. The Stochastic Oscillators have crossed northbound from the range of 20. And they are now around 60 and 70 ranges, seemingly trying to bend back. The base crypto may soon lose momentum to its flagship counter crypto in a correction mode.
Note: Cryptosignals.org is not a financial advisor. Do your research before investing your funds in any financial asset or presented product or event. We are not responsible for your investing results.
You can purchase Lucky Block here. Buy LBLOCK