Ethereum (ETH/USD) Market Trades Below $4,000
Estimated Reading Time: 3 minutes
Don’t invest unless you’re prepared to lose all the money you invest. This is a high-risk investment and you are unlikely to be protected if something goes wrong. Take 2 minutes to learn more
Ethereum Price Prediction – January 3
Despite a notable recovery motion in the ETH/USD trade operations, the crypto market yet trades below $4,000 until the present. Price has witnessed a higher value of $3,876 and a lower value of $3,730 as there has been a smaller negative percentage rate of 2.16.
ETH/USD Market
Key Levels:
Resistance levels: $4,000, $4,250, $4,500
Support levels: $3,500, $3,250, $3,000
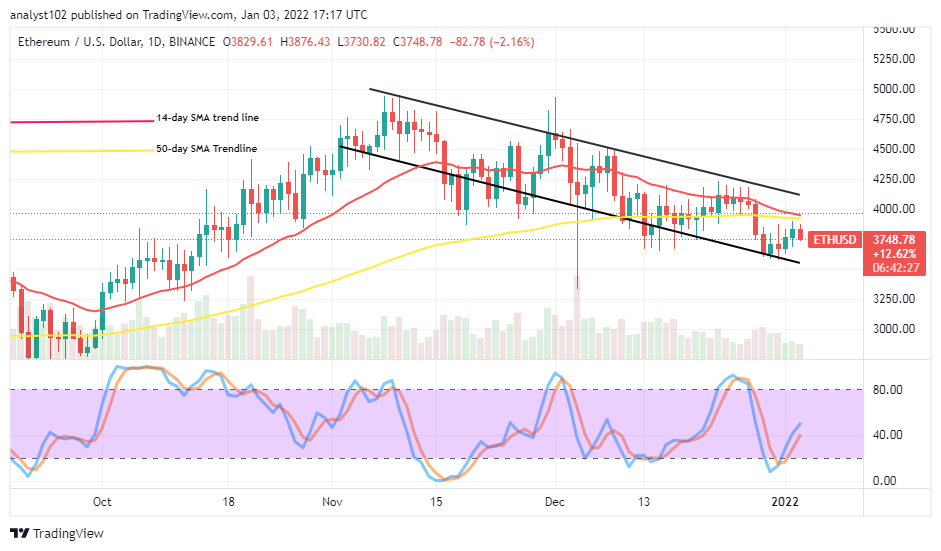
ETH/USD – Daily Chart
The ETH/USD daily chart shows the crypto-economic market trades below $4,000. The 14-day SMA trend line has moved down closer above the 50-day SMA trend line. There has been a formation of variant candlesticks signifying a beefing-up style that portends a promising upswing in the near time. The bearish correction channels are also intact, embodying the trend lines of the SMAs. The Stochastic Oscillators have crossed the lines northbound, briefly past the range of 40. That suggests that the crypto economy is relatively building up strength to make up stride.
Will the ETH/USD price surge northward as the crypto market trades below $4,000?
It may still be a while before ETH/USD price surge northward more as the crypto-economic market trades below $4,000. Currently, the $3,500 market-level appears to be a strong support line that price will have to push southward against and keep a long hold of the presumed trading scenario for sustainability. However, that value line could give birth to an apple condition to buying opportunities.
On the downside of the technical analysis, a successful interception of the 50-day SMA indicator by the 14-day SMA indicator may lead the market to get a series of downs in the long-term run. The $4,000 trading level has now come to the limelight as the barrier line to the upside. Therefore, only a sudden fearful break out at the value line could project the crypto-economy for more recovery motions.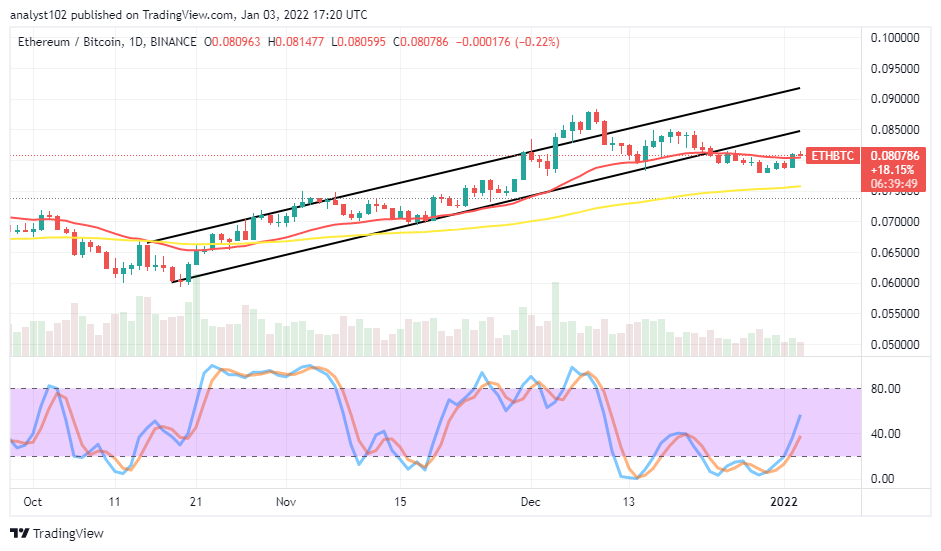
ETH/BTC Price Analysis
In comparison, the ETH/BTC price analysis chart shows that the cryptocurrency pair market trades below bullish channels. The base crypto appears, declining in its trending catalyst under a correction moving manner. The 50-day SMA indicator is underneath the 14-day SMA indicator. The Stochastic Oscillators have crossed briefly northbound against the range of 40. That signifies that Ethereum appears to push higher than Bitcoin in the subsequent sessions.
Note: Cryptosignals.org is not a financial advisor. Do your research before investing your funds in any financial asset or presented product or event. We are not responsible for your investing results.
You can purchase crypto coins here. Buy Tokens