Ethereum (ETH/USD) Market Valuation Features Below $3,000
Estimated Reading Time: 3 minutes
Don’t invest unless you’re prepared to lose all the money you invest. This is a high-risk investment and you are unlikely to be protected if something goes wrong. Take 2 minutes to learn more

Free Crypto Signals Channel
Ethereum Price Prediction – February 14
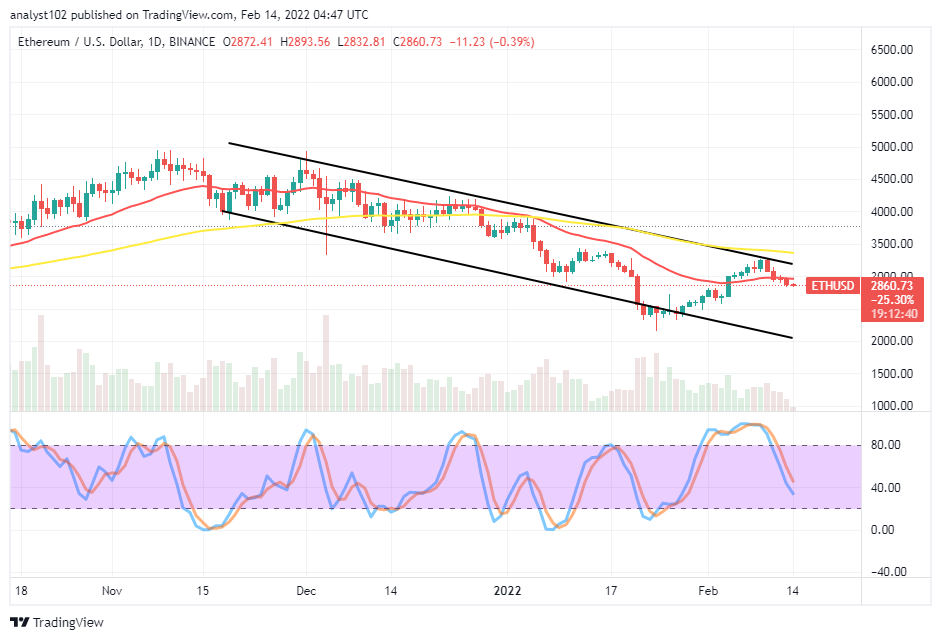
It presently shows that the ETH/USD market valuation features below $3,000 psychological resistance trading line as the crypto economy trade around $2,860 as of writing. The trade percentage is at around a negative 0.39.
ETH/USD Market
Key Levels:
Resistance levels: $3,250, $3,500, $3,750
Support levels: $2,750, $2,500, $2,250
.
ETH/USD – Daily Chart
The ETH/USD daily chart showcases the crypto-economic market valuation features below $3,000 in a downward trend returning style after hitting resistance at the upper trend line drawn. The 50-day SMA indicator is closely beneath the $3,500 resistance trading level above the 14-day SMA indicator. The Stochastic Oscillators have crossed southbound from the overbought region, briefly past the range of 40. And, it appears that a downward falling is in the card as a bearish candlestick is in the making.
Will the ETH/USD trade reverse against its current downing pace, as the crypto market valuation features below $3,000?
The ETH/USD trade operation may lack the sustainable capacity to reverse against its current downing pace as the crypto market valuation features below the $3,000 level. The $2,500 lower support level has to be the axis where an upswing may rebuild a catalyst. However, in the process of consolidating around the value-line, some more falling forces may dominate the trading spree that may lead to seeing a more-lower support level around $2,250 in the long run.
On the downside of the technical analysis, some falling pressures are to hold stronger as the price has been able to breach southward past the trend line of the smaller SMA around the level of $3,000. A sudden aggressive bouncing-off against the 14-day SMA trading indicator will the market heading back northward for a retest of resistance around the trend line of the 50-day SMA. It would be of a sound technical approach to always lookout for a sell entry at a higher resistance trading zone before sellers exert positions.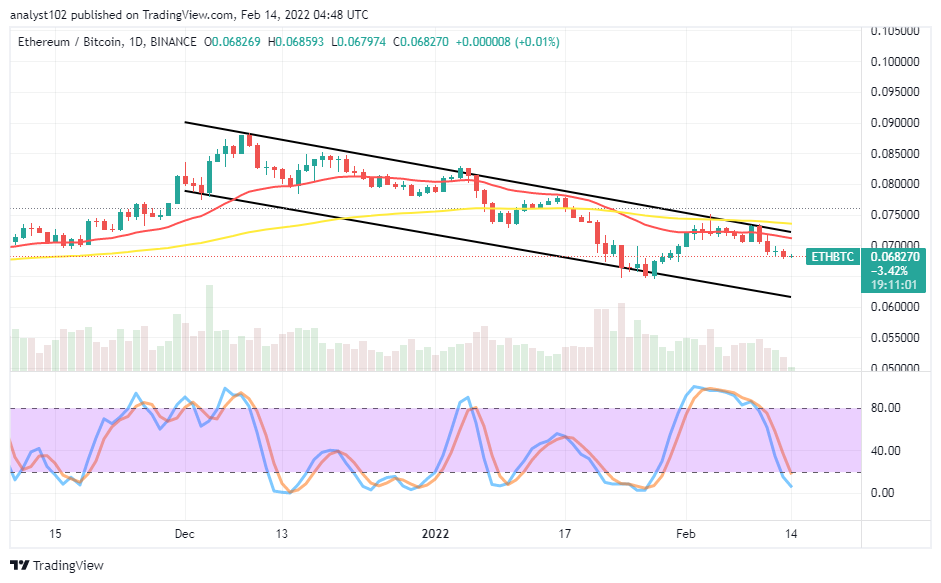
ETH/BTC Price Analysis
In comparison, Ethereum’s ability to push against Bitcoin has suffered a setback over a couple of days. The cryptocurrency pair market valuation features below the trend lines of the SMAs. The 50-day SMA indicator is above the 14-day SMA indicator, with a space separating them. The Stochastic Oscillators are making a fresh attempt by dipping into the oversold. Yet, the situation portends the base crypto giving fewer challenges to the trending ability of the flagship counter crypto.
Note: Cryptosignals.org is not a financial advisor. Do your research before investing your funds in any financial asset or presented product or event. We are not responsible for your investing results.
You can purchase crypto coins here. Buy Tokens