Ethereum (ETH/USD) Price Averages $1,700
Estimated Reading Time: 3 minutes
Don’t invest unless you’re prepared to lose all the money you invest. This is a high-risk investment and you are unlikely to be protected if something goes wrong. Take 2 minutes to learn more

Free Crypto Signals Channel
Ethereum Price Prediction – August 1
Recently, it has been that the ETH/USD market price averages $1,700 resistance-trading line to show the crypto economy has increased in its recovery-moving motion in the last several days. In the last few hours of today’s activities, the price has witnessed a high of $1,699 and a low of $1,675 at a minute positive percentage of 0.95.
ETH/USD Market
Key Levels:
Resistance levels: $1,750, $2,000, $2,250
Support levels: $1,250, $1,000, $750
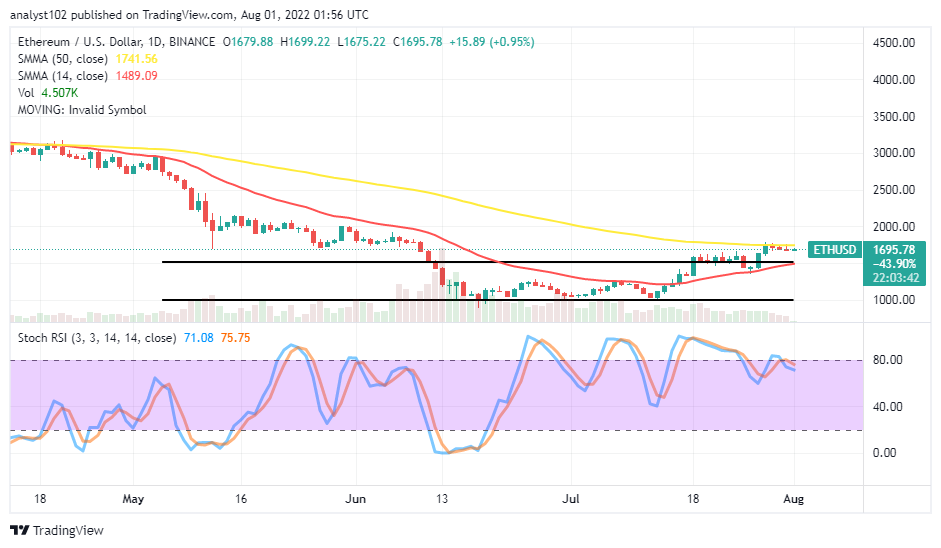
ETH/USD – Daily Chart
The ETH/USD daily chart shows the crypto-economic price averages the $1,700 resistance level in its bid, making recovery moves over a couple of sessions. The 50-day SMA indicator is at a resistance point of $1,741.56 above the 14-day SMA indicator, which is at $1,489.09. The range-bound zones remain between $1,000 and $1,500 below the current trading spot. The Stochastic Oscillators are around the 80 range, seemingly trying to cross the lines southbound. That signifies a warning against seeing a smooth upward run in the market in the near time.
Will there be high responsiveness to a downward motion beneath the ETH/USD market below $1,750?
There may be high responsiveness to a downward motion beneath the ETH/USD market below the $1,750 resistance level if bulls fail to build upon the rallying move that has propelled their recovery stances a bit out of the range-bound zones as the crypto-economic price averages $1,700. From the mere technical point of view, long-position placers tend not to have a smooth run in the market if there won’t be an emergence of a bullish candlestick to forcefully break variant resistance points to build a buying wall for subsequent positions.
On the downside of the technical analysis, the ETH/USD market bears have to intensify efforts against letting the market point break past the 50-day SMA trend line at $1,741.56 or the main resistance level of $1,750 afterward. It would be of a greater technically inclined that short-position takers be alert to spot when active rejections around the bigger SMA before considering launching a sell order.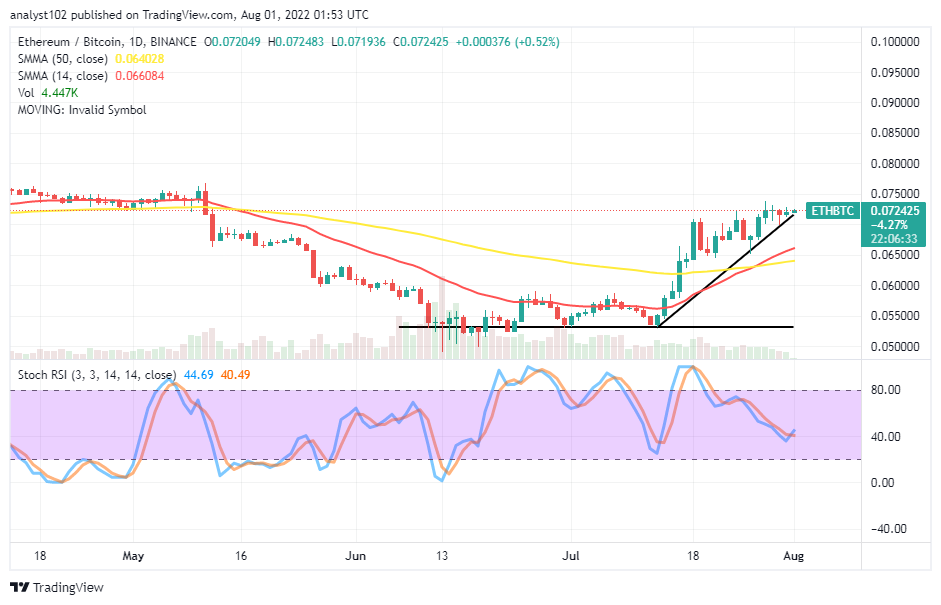
ETH/BTC Price Analysis
In comparison, Ethereum has been featuring firmly, retarding the trending capacity of Bitcoin over a couple of sessions. The 14-day SMA indicator has intercepted the 50-day SMA indicator to the upside. The bullish trend line drew, showing the path variant candlesticks have emerged in the north. The Stochastic Oscillators have moved southbound to the range point at 40. And they are trying to cross the lines northbound with a light attempt to indicate the base crypto has not given a damn to the downside with the counter-trading crypto.
Note: Cryptosignals.org is not a financial advisor. Do your research before investing your funds in any financial asset or presented product or event. We are not responsible for your investing results.
You can purchase Lucky Block here. Buy LBLOCK