Ethereum (ETH/USD) Price Features Corrections in $4,500 and $4,000
Estimated Reading Time: 3 minutes
Don’t invest unless you’re prepared to lose all the money you invest. This is a high-risk investment and you are unlikely to be protected if something goes wrong. Take 2 minutes to learn more
Ethereum Price Prediction – November 22
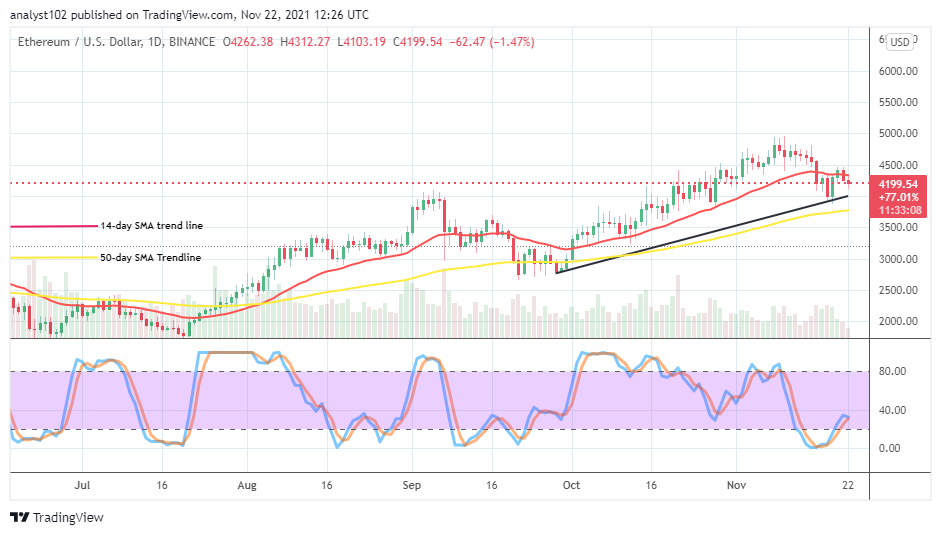
The ETH/USD financial book records that the crypto-economic price features corrections in $4,500 and $4,000 lines. The market’s valuation trades around $4,199 at a negative percentage rate of about 1.47 as of writing.
ETH/USD Market
Key Levels:
Resistance levels: $4,750, $5,000, $5,250
Support levels: $3,750, $3,500, $3,250
ETH/USD – Daily Chart
The ETH/USD daily chart reveals that the crypto-economic price features corrections in $4,500 and $4,000 trading levels. The 14-day SMA trend line is above the 50-day SMA trend line, slightly pointing toward the east direction with the formation of variant smaller candlesticks around it to indicate a short line of convergences. The bullish trend line drew a bit over the 50-day SMA indicator to timely observe a support level around the smaller value-line mentioned earlier. The Stochastic Oscillators have crossed northbound from the oversold region, trying to close the lines closely beneath the range of 40. That suggests that the market may soon experience a motion not featuring to the upside.
Will the ETH/USD market operation go more downward as the crypto-economic price features corrections in $4,500 and $4,000 currently?
A sudden downward pressure breaking at $4,000 will portend that the ETH/USD market operation will respond more positively for sometimes as the crypto’s price features corrections in $4,500 and $4,000 levels currently. In the aftermath of that assumption playing out afterward, it is most likely that there will be a quick re-bounding motion before or around the support level at $3,750. When that is spotted, long position takers may capitalize on it to launch a buy order.
On the downside of the ETH/USD market technical analysis, it appears that a resistance trading line has mounted around a higher level at $4,500. And, it may take a while before price can survive pushes northward above that line. As regards the ongoing slight depression beneath the value line, short position takers needed to exercise serious cautiousness to beat unnecessary bear’s trap in no time.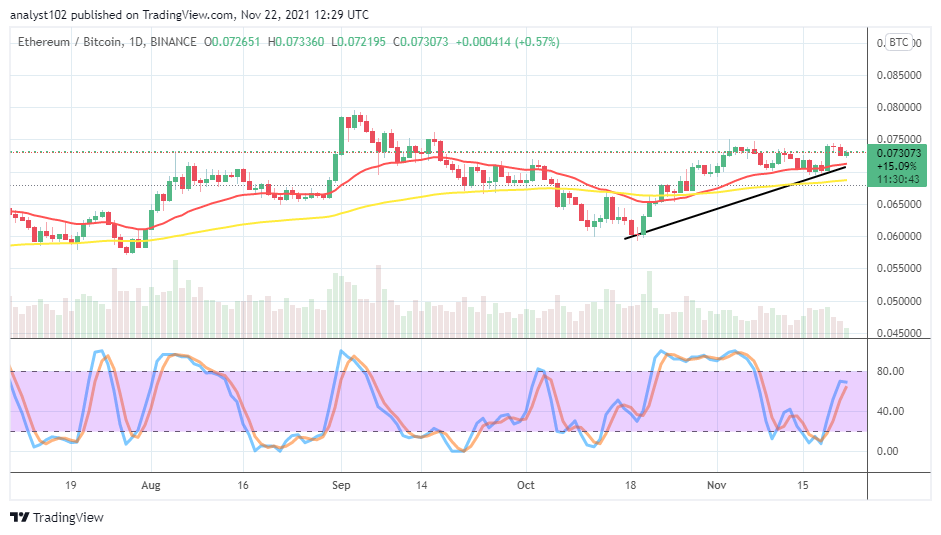
ETH/BTC Price Analysis
In comparison, Ethereum’s trending status features more or less in higher range-bound trading zones as paired with Bitcoin. In other words, the cryptocurrency pair economic price features, ranging in higher trading spots above the bigger SMA indicator. The 14-day SMA trend line has slightly moved into the range-bound zones above the 50-day SMA trend line. The bullish trend line drew across the bigger SMA to play a supportive role to the smaller SMA. The Stochastic Oscillators have protruded northbound from the oversold region, trying to close the lines closely beneath the range of 80. That suggests that the base crypto may still pause, pushing higher against the flagship counter-trading crypto for some time.
Note: Cryptosignals.org is not a financial advisor. Do your research before investing your funds in any financial asset or presented product or event. We are not responsible for your investing results.
You can purchase crypto coins here. Buy Tokens