Ethereum (ETH/USD) Price Trades at Overbought Zone
Estimated Reading Time: 3 minutes
Don’t invest unless you’re prepared to lose all the money you invest. This is a high-risk investment and you are unlikely to be protected if something goes wrong. Take 2 minutes to learn more
Ethereum Price Prediction – August 9
The Ethereum and the US Dollar Price trades at an overbought zone, pushing slightly past the line at $3,000. The crypto’s worth trades around the level of $3,123 at a positive percentage rate of 1.36.
ETH/USD Market
Key Levels:
Resistance levels: $3,500, $3,750, $4,000
Support levels: $2,750, $2,500, $2,250
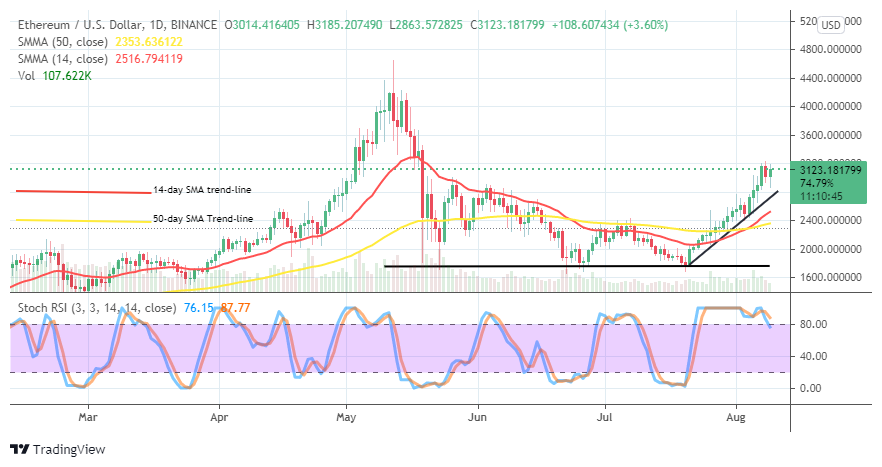
ETH/USD – Daily Chart
The daily trading chart showcases that the ETH/USD price trades at an overbought zone to suggest the need to be wary, exerting long positions. The location of the SMA indicators is a bit far below the current trading zone. The 50-day SMA trend-line has crossed northward by the 14-day SMA trend-line from below to the upside. The bullish trend-line drew across the trend lines of the SMAs to locate a point between $2,500 and $3,000. The Stochastic Oscillators have crossed the lines southbound briefly against the range at 80. That indicates that the crypto’s price may soon get reduced in valuation appreciation.
As the ETH/USD market features at an overbought zone, will it keep pushing higher further?
There could be some more upside movements above the point of $3,000. But, they tend to lose sustainability. The crypto’s price may lose momentum, attempting to move northward further from higher trading over the line mentioned earlier. Therefore, long-position trading takers needed to be wary of their re-launching of presences above that zone.
On the downside, the ETH/USD bears still have the chance to rebuild efforts to exert pressure on the crypto economy between the points of $3,000 and $3,500. In those values, the price may push for higher lows so that the market may witness an indecision trading situation. A decent sell entry may feature around the mid-point of the values mentioned earlier. Traders are to be on the lookout to achieve that.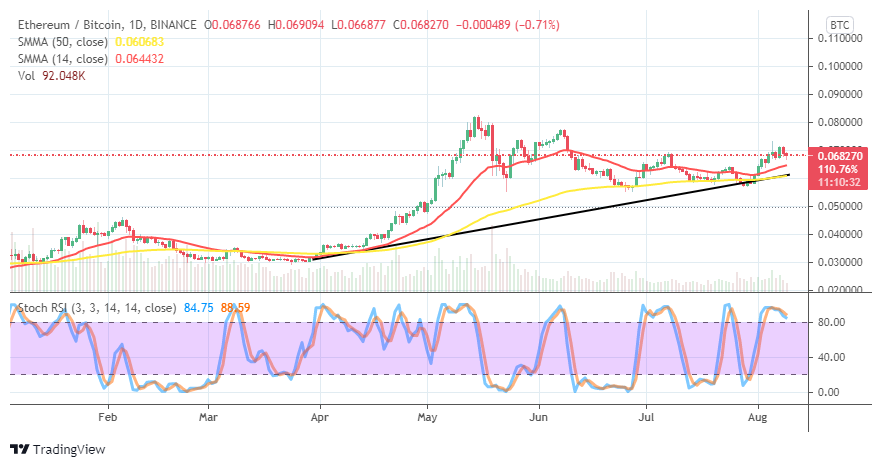
ETH/BTC Price Analysis
The trending weight between Ethereum and Bitcoin appears to have reached an overbought zone, as depicted on the price analysis chart. The bullish trend-line drew closely with the 50-day SMA trend-line below the 14-day SMA trend-line. The Stochastic Oscillators are in the overbought region, with the lines joined together, pointing southbound near the range of 80. That suggests that the base crypto possesses the sign of the capacity to counter crypto probably sooner than later.
Note: Cryptosignals.org is not a financial advisor. Do your research before investing your funds in any financial asset or presented product or event. We are not responsible for your investing results.
You can purchase crypto coins here. Buy Tokens