Ethereum (ETH/USD) Trade Attempts Rallying
Estimated Reading Time: 3 minutes
Don’t invest unless you’re prepared to lose all the money you invest. This is a high-risk investment and you are unlikely to be protected if something goes wrong. Take 2 minutes to learn more
Ethereum Price Prediction – November 29
After a long line of correction movements in the ETH/USD market, the crypto-economic trade now attempts to rally to the upside. The market makes a record of trading around $4,406, as of writing, with a percentage rate of about 2.51 positive. There has been a notable gradual uprise in the valuation of the crypto economy in the last few days’ sessions.
ETH/USD Market
Key Levels:
Resistance levels: $4,750, $5,000, $5,250
Support levels: $3,750, $3,500, $3,250
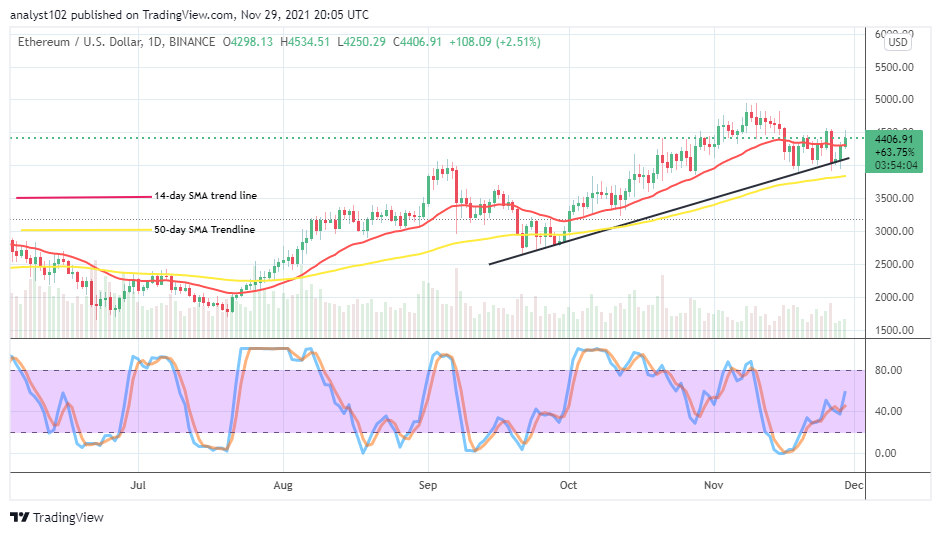
ETH/USD – Daily Chart
The ETH/USD daily chart showcases the crypto-economic trade attempts rallying severally over a couple of days back. The points between $4,500 and $4,000 have been the two zones where ups and downs in the market have featured. The 50-day SMA trend line is underneath the 14-day SMA trend line. The bullish trend line drew to timely observe the critical support level that the market finds a bit above the bigger SMA indicator. The Stochastic Oscillators are somewhat erratically swerving the lines northbound from the range of 20, briefly above the range at 40. That suggests the possibility of getting more ups in the subsequent sessions.
Will the ETH/USD market push past $4,500 as the crypto-economic trade attempts rally?
The ETH/USD market long-position takers now needed to intensify efforts to push northward past $4,500 as the crypto trade attempts rallying from a lower-high trading zone bordering around the level of $4,000. The positioning of the 50-day SMA on the trading chart gives more reliable optimism that the latterly mentioned value-line serves as a critical support baseline to some of the downward pressures featuring recently in the market.
On the downside of the technical analysis, selling pressures may have to allow another round of hip-trading pattern, when the price might have got to a high area, witnessing several rejections above $4,500 before considering launching the sell order. It seems unsafe to exert a short order around the $4,500 now that the market has shown a signing of rebounding close to it presently.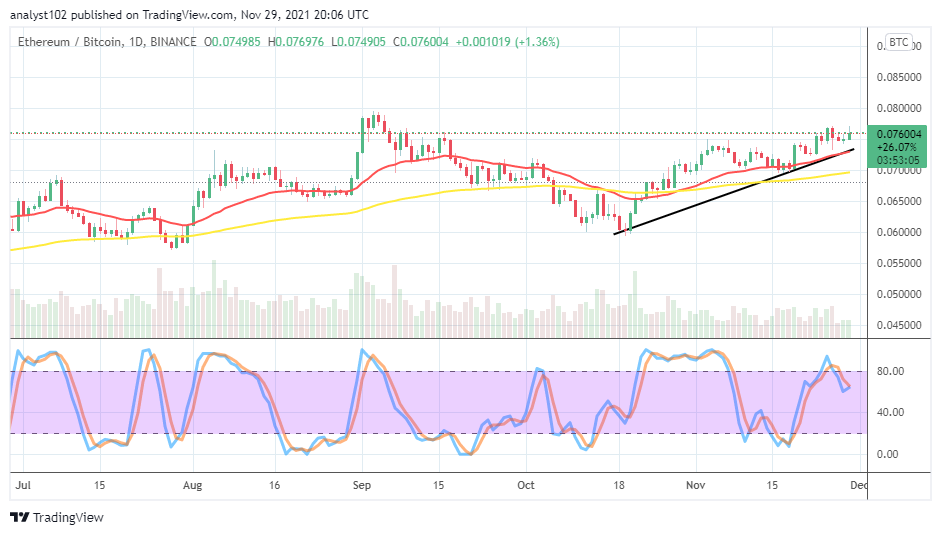
ETH/BTC Price Analysis
In comparison, Ethereum’s trend capacity outlook against Bitcoin, appears that the base crypto still dominates the trending directions. The currency pair trade attempts converging at a higher trading level above the trend lines of the SMAs. The 14-day SMA indicator is above the 50-day SMA indicator. The bullish trend line drew across the bigger SMA to conjoin with the 14-day SMA at the end point. The Stochastic Oscillators have initially moved southbound from the overbought region. But, they now try to close the lines in an attempt to point back northbound. That suggests that the base crypto still has the chance to trend more higher against its counter trading crypto.
Note: Cryptosignals.org is not a financial advisor. Do your research before investing your funds in any financial asset or presented product or event. We are not responsible for your investing results.
You can purchase crypto coins here. Buy Tokens