Ethereum (ETH/USD) Trade Pushes in a Rallying Motion
Estimated Reading Time: 3 minutes
Don’t invest unless you’re prepared to lose all the money you invest. This is a high-risk investment and you are unlikely to be protected if something goes wrong. Take 2 minutes to learn more

Free Crypto Signals Channel
Ethereum Price Prediction – June 27
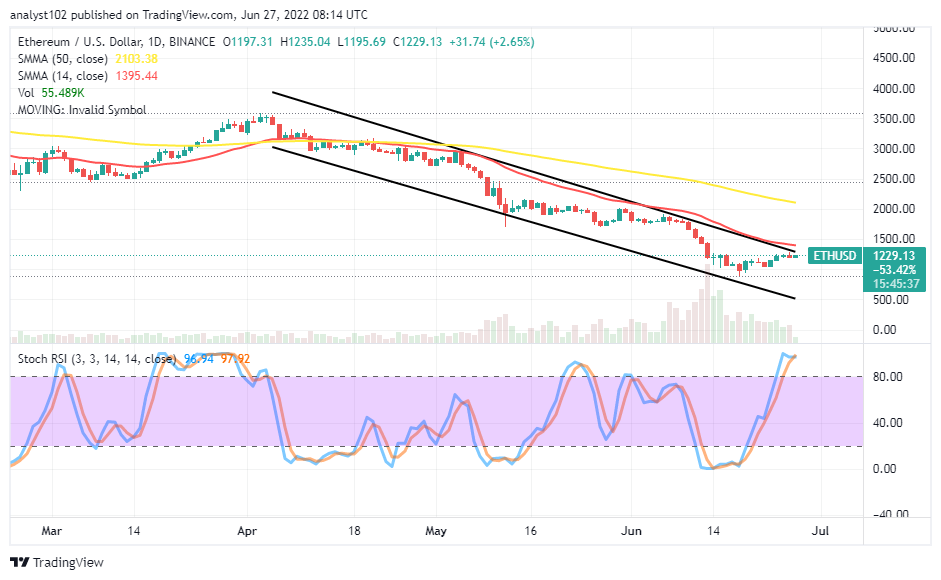
The ETH/USD market operations almost get exhausted in its movements to the upside as the crypto trade pushes in a rallying motion. Price flutters between $1,235 and $1,195 at an average positive percentage rate of 2.65.
ETH/USD Market
Key Levels:
Resistance levels: $1,500, $1,750, $2,000
Support levels: $1,000, $750, $500
ETH/USD – Daily Chart
The ETH/USD daily chart showcases the crypto trade pushes in a rallying motion close to the sell signal side of the smaller SMA. The outward resistance level is at $1,500 when the 14-day SMA indicator indicates $1,395 underneath the trend line of the 50-day SMA. The bearish trend line drew alongside the smaller SMA, placing around those resistance values. The Stochastic Oscillators are in the overbought region with their lines closed to portend the possibility of getting a bearish move in the near time.
What’s the higher probable directional move that the ETH/USD market may get soon?
As the ETH/USD trade pushes in rallying motion, the higher probable directional move the crypto economy may get soon appears to face variant resistances around the trend line of the 14-day SMA. If the price succeeds at breaking out past the $1,500 resistance level, the forces will potentially propel it to a higher level. Long-position takers need to be wary of jumping into the market while that assumption tends to materialize.
On the downside of the technical analysis, the ETH/USD market bears will have to brace up against any possible occurrence of a breakout around the $1,500 resistance trading level. Price may return to a downward-trending after experiencing a pit stop around the value line. In the meantime, the $1,000 support level may stand a long way in detecting a buying order. Alternatively, traders may base their entry of position orders on the Stochastic Oscillators’ reading pari passu with what is obtainable with price action at a material time.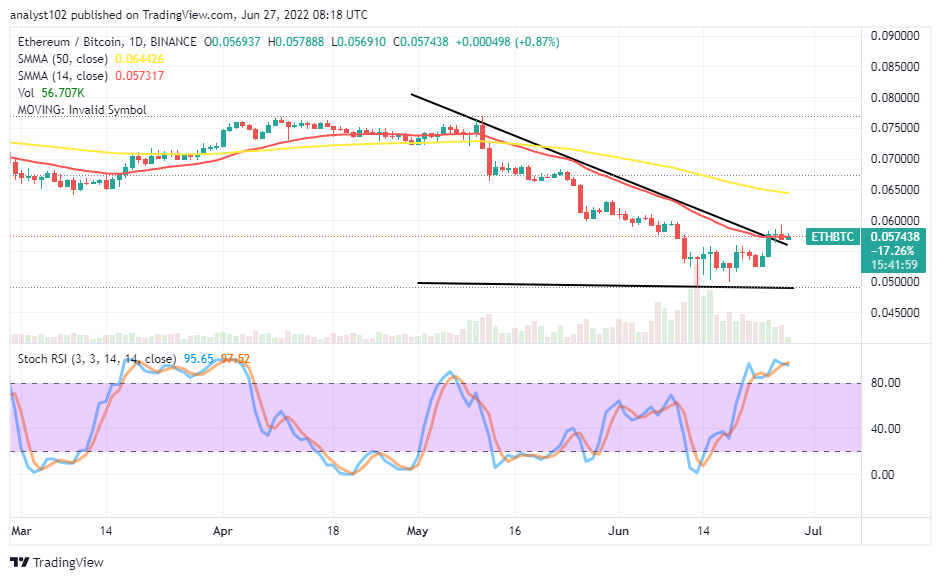
ETH/BTC Price Analysis
Ethereum has been struggling to move against the trending capability of Bitcoin. The cryptocurrency pair trade pushes in a rallying motion to the point of the smaller SMA trend line. The 14-day SMA trend line is underneath the 50-day SMA trend line. The Stochastic Oscillators are in the overbought region, seemingly trying to start moving in a consolidation manner. The base crypto has had an overbought reading condition in its analytics and may soon witness a debasement in its trending capacity, pairing with the flagship counter crypto.
Note: Cryptosignals.org is not a financial advisor. Do your research before investing your funds in any financial asset or presented product or event. We are not responsible for your investing results.
“Lucky is up more than 50% today but still more than 430% from All Time Highs!
The opportunity to bank BIG is now!
You can purchase Lucky Block here. Buy LBlock