Ethereum (ETH/USD) Trade Swings from $2,750 Support
Don’t invest unless you’re prepared to lose all the money you invest. This is a high-risk investment and you are unlikely to be protected if something goes wrong. Take 2 minutes to learn more

Free Crypto Signals Channel
Ethereum Price Prediction – May 2
The ETH/USD market operations record that the crypto-economic trade swings from $2,750 support after briefly breaching down for a while. The market is currently trading around the $2,829 line, keeping a minimal positive percentage rate of about 0.14.
ETH/USD Market
Key Levels:
Resistance levels: $3,000, $3,250, $3,500
Support levels: $2,750, $2,500, $2,250
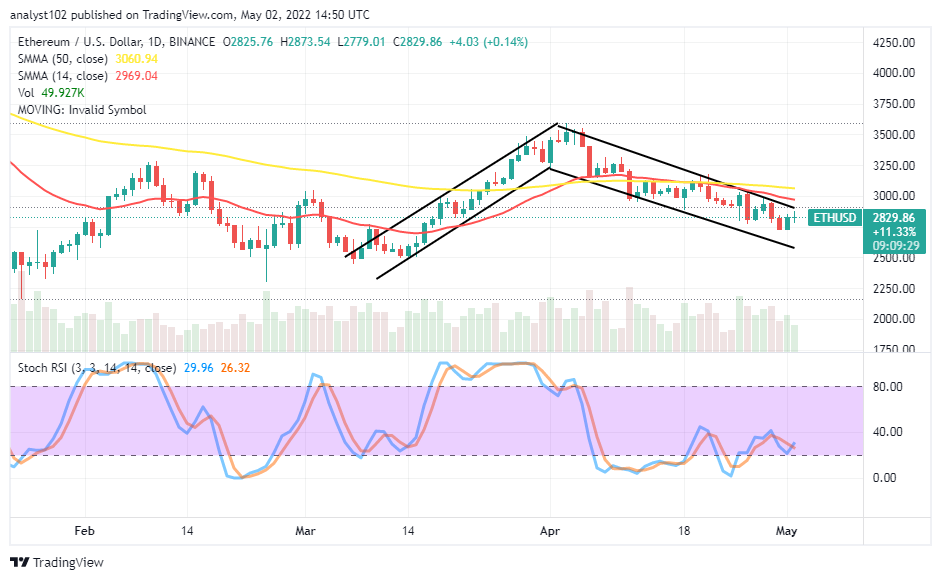
ETH/USD – Daily Chart
The ETH/USD daily chart shows the crypto-economic trade swings from the $2,750 support level. The value line breached downward briefly during yesterday’s sessions. The 14-day SMA indicator has faintly moved southward below the $3,000 resistance level as the 50-day SMA indicator is at the top. The Stochastic Oscillators are swinging around the 40 and the 20 ranges as the bullish flag pattern is intact.
With the formation of yesterday’s bullish candlestick in the ETH/USD market, can there be a reversal move against it in the near time?
If a sudden aggressive reversal move has to resurface in the near time, then the formation of yesterday’s bullish candlestick in the ETH/USD market operations will nullify. Following that effect, the $2,750 critical support level will run into a resistance afterward. Meanwhile, such a trading circumstance will allow bulls to get in for a re-launch of a come-back at a lower-trading zone.
On the downside of the technical analysis, the ETH/USD market short-position players may have to use a rejection signal at some points closely beneath the $3,000 resistance level in the short and medium-term runs of the crypto economy. That, by practice, can be achieved via using 1-hour and 4-hour time frames. Nevertheless, a slow-and-steady moving mode may play if the forces to back attempts of reversing an upward move around the resistant-trading area aren’t strong enough.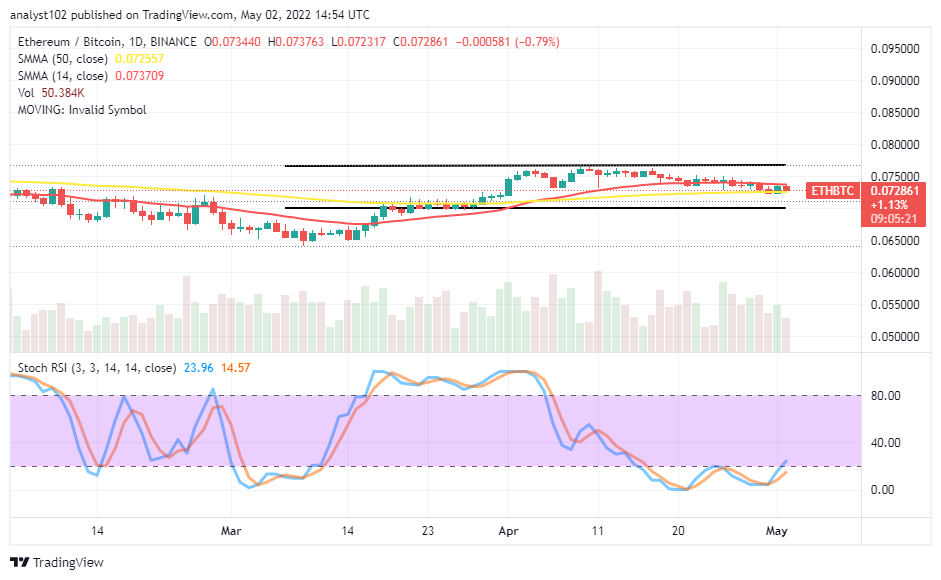
ETH/BTC Price Analysis
Ethereum is lessening in its trending capacity in a low-key outlook against Bitcoin. The cryptocurrency pair trade swings in definite range-bound zones. The 14-day SMA trend line has slantingly bent southward above the 50-day SMA trend line, and they are in the range-bound zones. The Stochastic Oscillators are moving in a consolidation style in the oversold region. To some extent, the base crypto is still holding a trending catalyst against its flagship counter crypto until the present.
Note: Cryptosignals.org is not a financial advisor. Do your research before investing your funds in any financial asset or presented product or event. We are not responsible for your investing results.
You can purchase Lucky Block here. Buy LBlock: