Litecoin (LTC/USD) Approaches $200 Resistance
Estimated Reading Time: 3 minutes
Don’t invest unless you’re prepared to lose all the money you invest. This is a high-risk investment and you are unlikely to be protected if something goes wrong. Take 2 minutes to learn more
Litecoin Price Prediction – June 1
Litecoin versus the US Dollar market operation approaches $200 resistance in a slow-down rallying manner. The crypto now witnesses a reduction of -2.03% to trade around the value of about $184 or thereabout.
LTC/USD Market
Key Levels:
Resistance levels: $200, $250, $300
Support levels: $150, $130, $110
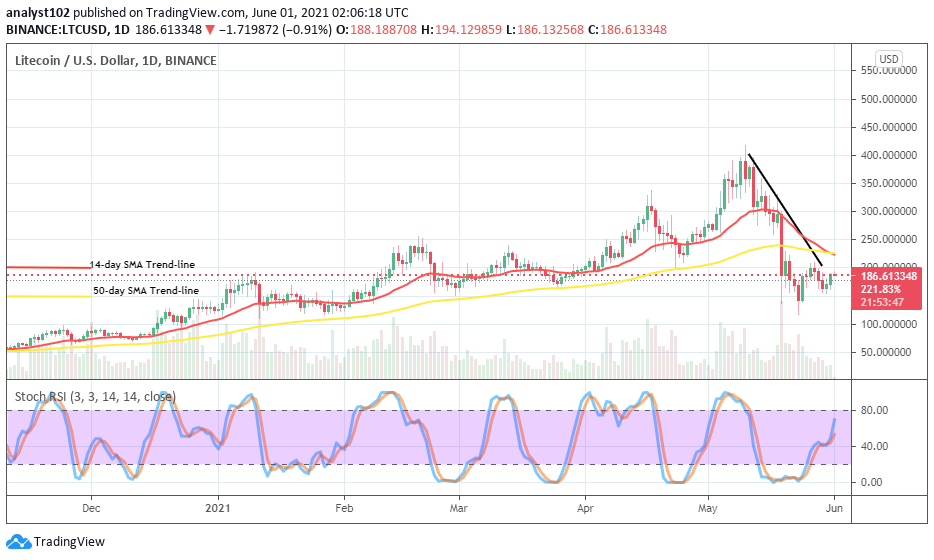
LTC/USD – Daily Chart
The LTC/USD still has it that the crypto market needs to feature close below the resistance value of $200. In about a couple of days’ sessions, price lightly went down near the support level of $150 before witnessing a slow-reversal move that has brought back the market close below the point earlier mentioned. The 50-day SMA indicator is now on the verge of being intercepted from the top by the 14-day SMA trend-line as the bearish trend-line drew down across them to mark $200 resistance as yet being a vital trading line. The Stochastic Oscillators have opened the hairs to the north closely below range 80. But, they do not signify that much upward pressure will be seen in the near crypto’s business transaction.
Will the LTC/USD market be able to break past the $200 resistance point?
From most of the technical perspectives, the kind upswing that the LTC/USD market has been put up with lacks the most-needed pushing effort to break past the $200 resistance northbound. But, in the meantime, a degree of mustering catalyst is still exhibited by bulls in the crypto trading activities. A full bullish-body formed candlestick around the point in question will possibly nudge the crypto-economy into a better high trading zone.
As there has been a sign that the 50-day SMA indicator will most likely get intercepted from the top by the 14-day SMA trend-line, it shows that somewhat somehow there will still be downs in this market. The points around or between $250 and $200 are potentially going to be the zones where that presumed trading scenario will play out. In the event of price witnessing a low-active move, the situation may result in sideways trading activities going to involve the latter value mentioned earlier.
LTC/BTC Price Analysis
To some extent, there has been a line of recovery by Litecoin as paired with Bitcoin as depicted on the daily chart. As of writing, different candlesticks are being formed trying to touch the smaller SMA from below for a possible breakout. The 50-day SMA indicator is underneath the 14-day SMA trend-line while the bullish trend-line drew below them at a little space distancing from them to place at a pick-up off zone of the base crypto against the counter crypto. The Stochastic Oscillators have slightly opened the hairs to the north briefly past range 40. That shows that Litecoin still has the potential of trending more against the most valuable Bitcoin in the world of crypto economies presently.
Note: new.cryptosignals.org is not a financial advisor. Do your research before investing your funds in any financial asset or presented product or event. We are not responsible for your investing results.