Litecoin (LTC/USD) Market Converges at $55
Estimated Reading Time: 3 minutes
Don’t invest unless you’re prepared to lose all the money you invest. This is a high-risk investment and you are unlikely to be protected if something goes wrong. Take 2 minutes to learn more
Litecoin Price Prediction – November 1
It has been that the LTC/USD market converges at the $55 resistance line Some declining forces have signaled to dominate the possibility of getting ups as price trades around $54.856 at a rate of minute 0.32 percent.
LTC/USD Market
Key Levels:
Resistance levels: $55, $60, $65
Support levels: $50, $45, $40
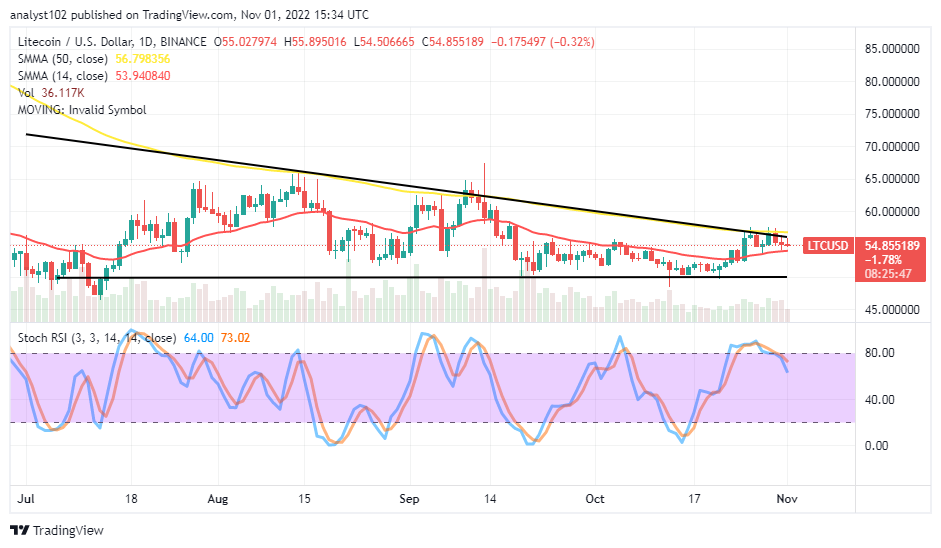
LTC/USD – Daily Chart
The daily chart showcases the crypto market converges around the $55 resistance trading level. The 50-day SMA indicator trends southward alongside the bearish trend line drew to place around the upper price converging spot above the 14-day SMA indicator, which is at $53.94 value line. The Stochastic Oscillators have crossed southbound against the 80 range to a position at 73.02 and 64.00 range values. That showcases the market may lose momentum in the subsequent session.
Will the LTC/USD trade increase values beyond the point of the 50-day SMA at $56.80?
The LTC/USD trade bulls may not move the crypto economy past the 50-day SMA trend line around $56.80 as the market converges around it over time. From the technical point of view, the price tends to run a pit stop style, coupled with an indecision condition around the bigger SMA and the bearish trend line drawn to back it. Without much ado, the current situation doesn’t support any buying entry.
On the downside of the technical analysis, there is a greater probability that the LTC/USD price will lose momentum sooner than later from around the trend line of the 50-day SMA indicator. An active declining motion has to surface to breach the trend line of the 14-day SMA to the downside to let bears ride on smoothly. The market won’t make its way down to the horizontal line at the $50 support level soon.
LTC/BTC Price Analysis
In comparison, Litecoin remains trying to rebuild stances against the trending ability of Bitcoin. The cryptocurrency pair market converges at a high point around the SMA trend lines about some days back. The 14-day SMA indicator is above the 50-day SMA indicator. The Stochastic Oscillators have crossed southbound to the range values of 33.43 and 25.83. That demonstrates that the base cryptocurrency is still somewhat giving in to the pressures the counter-trading cryptocurrency is exerting forces on it.
Note: Cryptosignals.org is not a financial advisor. Do your research before investing your funds in any financial asset or presented product or event. We are not responsible for your investing results.
You can purchase Lucky Block here. Buy LBLOCK