Litecoin (LTC/USD) Market Drops to Find Support at $50
Estimated Reading Time: 3 minutes
Don’t invest unless you’re prepared to lose all the money you invest. This is a high-risk investment and you are unlikely to be protected if something goes wrong. Take 2 minutes to learn more

Free Crypto Signals Channel
Litecoin Price Prediction – May 17
The recent dumping motions in the market pace of crypto economies hurt Litecoin against the US trading economy. Currently, it is that the market drops to find support at $50. Price has sprung up to feature between $71 and $66 at a percentage of 6.41 positives.
LTC/USD Market
Key Levels:
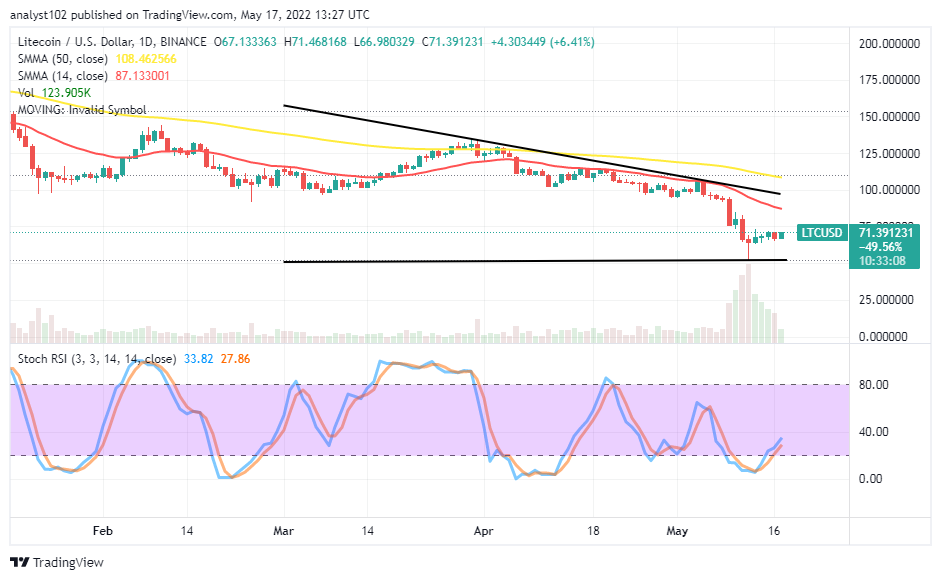
Resistance levels: $75, $100, $125
Support levels: $50, $35, $20
LTC/USD – Daily Chart
The LTC/USD daily chart shows the crypto-economic market drops to find support at $50 during May 12th trading operations. It wasn’t too long before the crypto trade swung upward from the point to be featuring closely beneath the $75 trading resistance level being the subsequent days until the now. The 14-day SMA trend line is underneath the 50-day SMA trend line. The Stochastic Oscillators have slightly crossed northbound from the oversold region against the range of 20. And they are still relatively pointing to the upside, denoting that some upward forces are ongoing on a lighter mode.
Will the LTC/USD market spring upward to get resisted around the 14-day SMA?
As indicated on the daily chart, it would be psychologically ideal to wait for what will be the reaction of price around the trend line of the 14-day SMA; which is around the $80 resistance zone, to observe whether the downward movement will re-surface to counter the efforts at swinging up in the near term. In the meantime, the current market’s trading condition suggests an opportunity outlook for an investment plan.
On the downside of the technical analysis, the LTC/USD market short-position placers, may in the habit of downing trend, have to watch out for any attempt by price to give in to active corrections around the $75 resistance level before considering launching a sell order. Opening a new shorting position at that point needed to be done with cautiousness as the crypto economy is trading at a deep-shallow zone that can in no time witness sudden bounce-offs.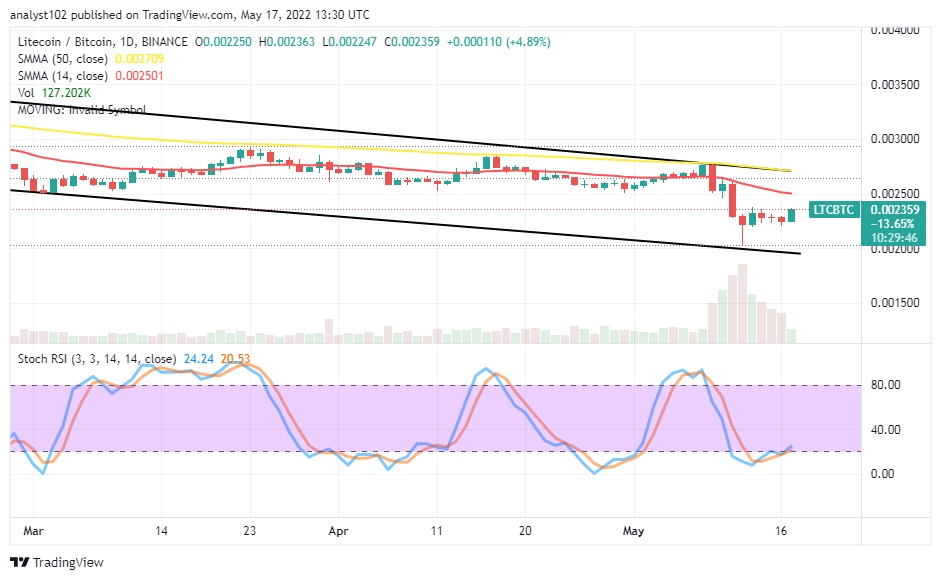
LTC/BTC Price Analysis
In comparison, Litecoin’s trending capability against Bitcoin has been experiencing a downward movement over time. The cryptocurrency pair market drops to find support around the lower bearish channel trend line drawn. The 14-day SMA indicator is beneath the 50-day SMA indicator. The Stochastic Oscillators are down slightly beneath the range of 20 in the oversold region, seemingly attempting to consolidate around the range zone to show the possibility of the base crypto trying to regain its stances in the near time against its countering flagship crypto.
Note: Cryptosignals.org is not a financial advisor. Do your research before investing your funds in any financial asset or presented product or event. We are not responsible for your investing results.
You can purchase Lucky Block here. Buy LBlock: