Litecoin (LTC/USD) Market Holds Below a Falling Force
Estimated Reading Time: 3 minutes
Don’t invest unless you’re prepared to lose all the money you invest. This is a high-risk investment and you are unlikely to be protected if something goes wrong. Take 2 minutes to learn more

Free Crypto Signals Channel
Litecoin Price Prediction – March 1
Despite a line of variant happenings in the LTC/USD trade operations, showcasing increases in most crypto economies, the market holds below a falling force with less active moves to the upside. $116 and $109 have been the trading zones within which the crypto’s price has been at a minute negative percentage of 0.53.
LTC/USD Market
Key Levels:
Resistance levels: $125, $130, $135
Support levels: $100, $95, $85
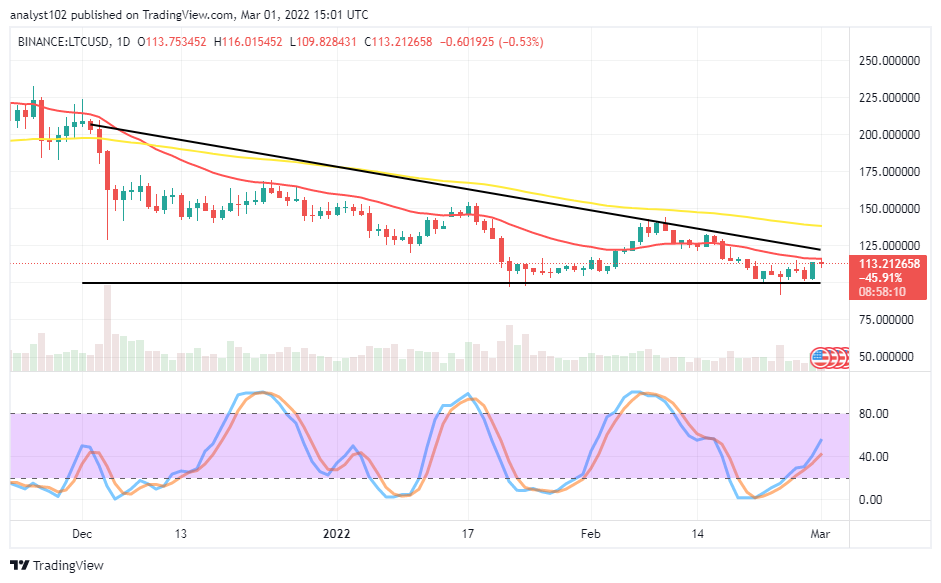
LTC/USD – Daily Chart
The LTC/USD daily chart reveals the crypto-economic market holds below a falling force closely around the trend line of the smaller SMA. The 50-day SMA indicator is above the 14-day SMA indicator. The Stochastic Oscillators positioned slantingly northbound from the oversold region a bit over the range of 40. There is a tinier candlestick in the making to determine the next price direction.
Should traders join a move to the upside as the LTC/USD market holds below a falling force?
A technical thought believes that traders may need to stop placing an order for a while on the LTC/USD trade as the crypto-economic market holds below a falling force. If there’ll be still necessary northward pushing, points of resistance between $125 and underneath that of a higher value-line at $150 may reach. The situation portends a need for a necessary rallying motion for some time to materialize.
On the downside of the technical analysis, a pull-up is necessary for the price to hit resistance around $125 so that bears will have to garner energy. There is not much volatility to either of the definite directions and as a result, short-position placers will also have to be wary of their re-entrance back in the market. A decent sell entry is around the resistance trading level mentioned earlier. A picture of that assumed scenario will achieve when the pushes northward for exhaustion before returning to the downside.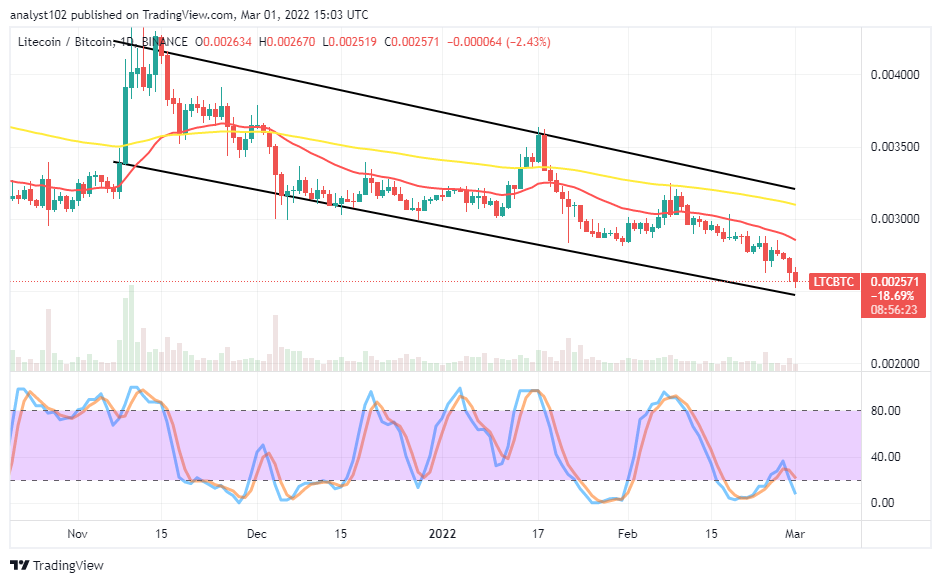
LTC/BTC Price Analysis
In comparison, Litecoin moves southward as countered by Bitcoin. The cryptocurrency pair market holds below the trend lines of the SMAs presently. The 14-day SMA indicator is underneath the 50-day SMA indicator. The bearish channel trend lines drew to enclose the SMAs. And there has a bearish candlestick in the making extending toward the lower end. The Stochastic Oscillators have crossed the southbound within 40 and 20 ranges to the oversold region. The base crypto may soon resume falling more with the flagship counter cryptocurrency.
Note: Cryptosignals.org is not a financial advisor. Do your research before investing your funds in any financial asset or presented product or event. We are not responsible for your investing results.
You can purchase Lucky Block here. Buy LBlock: