Litecoin (LTC/USD) Market Is Gaining Momentum at SMA Points
Estimated Reading Time: 3 minutes
Don’t invest unless you’re prepared to lose all the money you invest. This is a high-risk investment and you are unlikely to be protected if something goes wrong. Take 2 minutes to learn more
Litecoin Price Prediction – November 15
Some events have occurred in the LTC/USD trading operations operating in a dropping manner to a lower place, which has now changed to the crypto market gaining momentum at the SMA points. .Price is maintaining a 2.98% positive, trading around $5.28 value line as of the time of writing. As of this writing, the price is 2.98% higher, trading at the $5.28 value line.
LTC/USD Market
Key Levels:
Resistance levels: $65, $70, $75
Support levels: $50, $45, 440
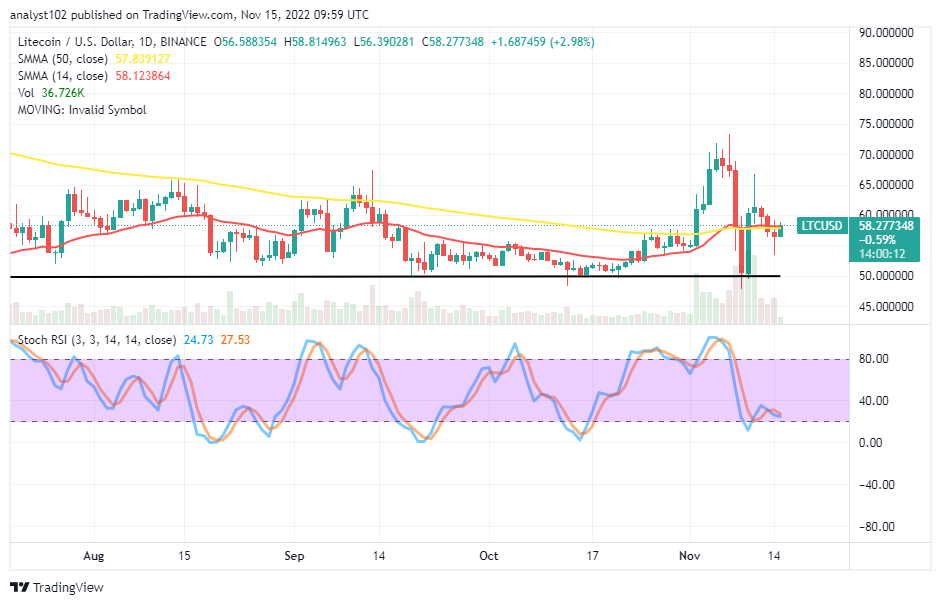
LTC/USD – Daily Chart
The LTC/USD daily chart reveals the crypto market is gaining momentum around the SMA points. The 14-day SMA indicator is at $58.123864, over the $57.839127 value line of the 50-day SMA indicator. Those figures show that they are not far from each other. The Stochastic Oscillators are around 27.53 and 24.73 range values, with a smaller bullish candlestick in the making. That attests to the confirmation that an upward force is ongoing.
Will the LTC/USD market operations maintain their positions above the horizontal line drawn at the $50 support level?
It is most likely that the LTC/USD trade activities will keep stances above the $50 support level as the crypto economy is gaining momentum around the trend lines of the SMAs. Long-position traders should be strategic when executing an order at a given point, keeping an eye out for a bouncing-off trading situation in a lower-trading zone. The bullish candlestick that emerged during the November 10th session bottomed firmly around the support spot to ascertain the length of buying wall already obtained in the market.
On the downside of the technical analysis, the LTC/USD market bears may make a comeback while the price pulls up falsely to encounter resistance around the $65 level. Short-position placers will need to exercise patience before dabbing into taking a sell order afterward. A sudden breakout of the trading area will shift the position to a higher-resistance zone between $70 and $75 in the long run.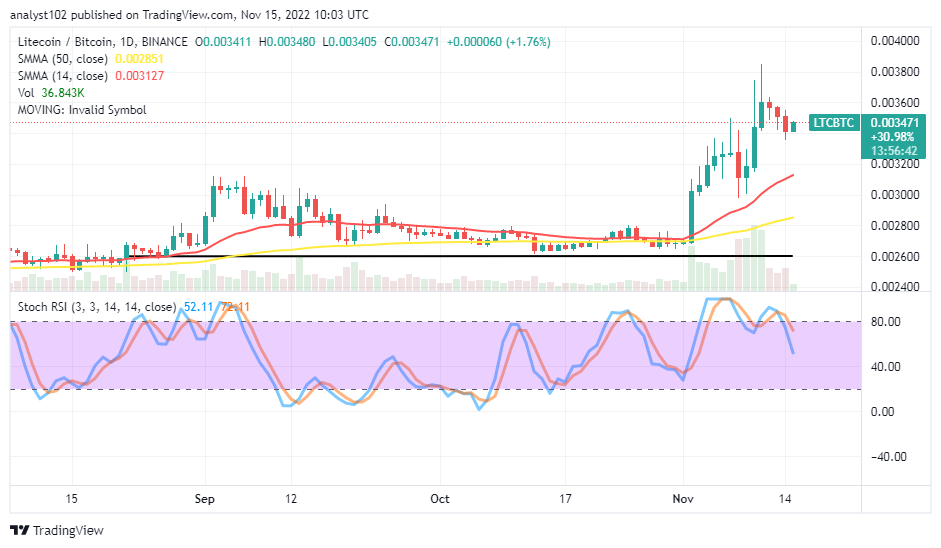
LTC/BTC Price Analysis
In comparison, Litecoin’s trending ability experiences light lines of corrections far over the trend lines of the SMAs against Bitcoin. The cryptocurrency pair market appears not, losing so much energy to the downside. The 14-day SMA indicator is underneath the current featuring of trading candlesticks, and the 50-day SMA indicator is below it. The Stochastic Oscillators have crossed southbound from the overbought region to position around 72.11 and 52.11 levels. That indicates the base crypto may soon lessen pressures to retard its counter-trading crypto.
Note: Cryptosignals.org is not a financial advisor. Do your research before investing your funds in any financial asset or presented product or event. We are not responsible for your investing results.
You can purchase Lucky Block here. Buy LBLOCK