Litecoin (LTC/USD) Price Downturns, Touching $100
Estimated Reading Time: 3 minutes
Don’t invest unless you’re prepared to lose all the money you invest. This is a high-risk investment and you are unlikely to be protected if something goes wrong. Take 2 minutes to learn more

Free Crypto Signals Channel
Litecoin Price Prediction – February 22
It would be the second round that the LTC/USD market operations visit a lower-trading spot around $100 as the crypto-economic price downturns in its valuations. There have been values of $105 and $100 within which price features at a smaller positive percentage rate of about 1.18.
LTC/USD Market
Key Levels:
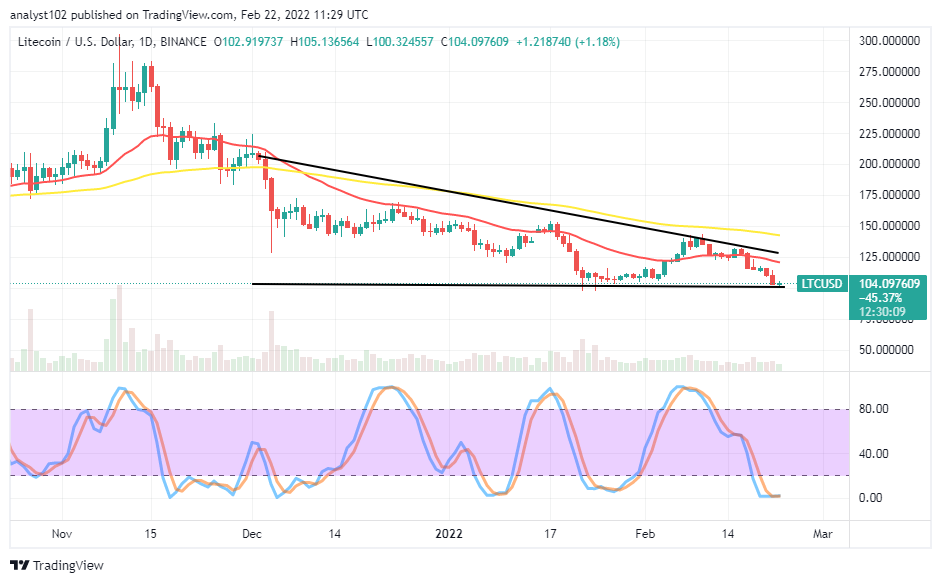
Resistance levels: $120, $135, $150
Support levels: $95, $85, $75
LTC/USD – Daily Chart
The LTC/USD daily chart showcases the crypto-economic price downturns, touching the $100 level for the second time since the commencement of the bearish trading cycle this year. The value-line appears to be the critical support baseline against seeing the further smooth-downward running of the market. The 14-day SMA indicator is underneath the 50-day SMA indicator. The Stochastic Oscillators are in the oversold region with their lines conjoined. That could mean the price is in a state of consolidating as of writing.
As the LTC/USD price downturns to touch the $100 level, can there be more room for down-turning trading activities in the subsequent sessions?
More rooms intended for down-turning trading activities in the LTC/USD market subsequent sessions may not line longer as the crypto-economic price downturns, touching the $100 level. Going by that assumption, the market has to push back for more ups while another round of lower lows can play out in the process around the point mentioned earlier for some time. A further breach of the level can be one of the best times for investors to add to their long-term portfolio.
On the downside of the technical analysis, consolidation of the short-position placers around the $100 level may not suggest a good time to launch a sell order. The market tends to move southward against the support baseline drawn at the $100 trading level but doesn’t have the sustainability sign. Based on that, it would be psychologically sound well to suspend the placing of further sell orders.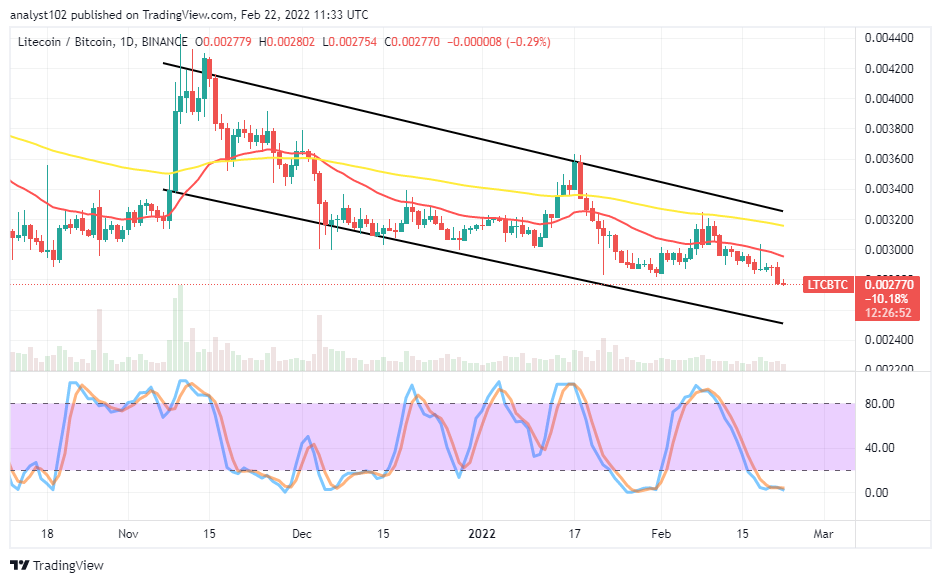
LTC/BTC Price Analysis
In comparison, Litecoin still features under a falling set-up pattern as placed with Bitcoin. The pairing of the duo cryptos in that order showcases that price downturns underneath the SMAs. The 50-day SMA trend line is above the 14-day SMA trend line. And they positioned southward to indicate that a selling force is prevailing in the LTC/BTC trading activities. The Stochastic Oscillators are in the oversold region, clogging their lines within it. That signifies an affirmation that the base crypto is yet to push stances against the most valuable counter crypto of the world.
Note: Cryptosignals.org is not a financial advisor. Do your research before investing your funds in any financial asset or presented product or event. We are not responsible for your investing results.
You can purchase Lucky Block here. Buy LBlock: