Litecoin (LTC/USD) Price Fluctuates at $200
Estimated Reading Time: 3 minutes
Don’t invest unless you’re prepared to lose all the money you invest. This is a high-risk investment and you are unlikely to be protected if something goes wrong. Take 2 minutes to learn more
Litecoin Price Prediction – November 2
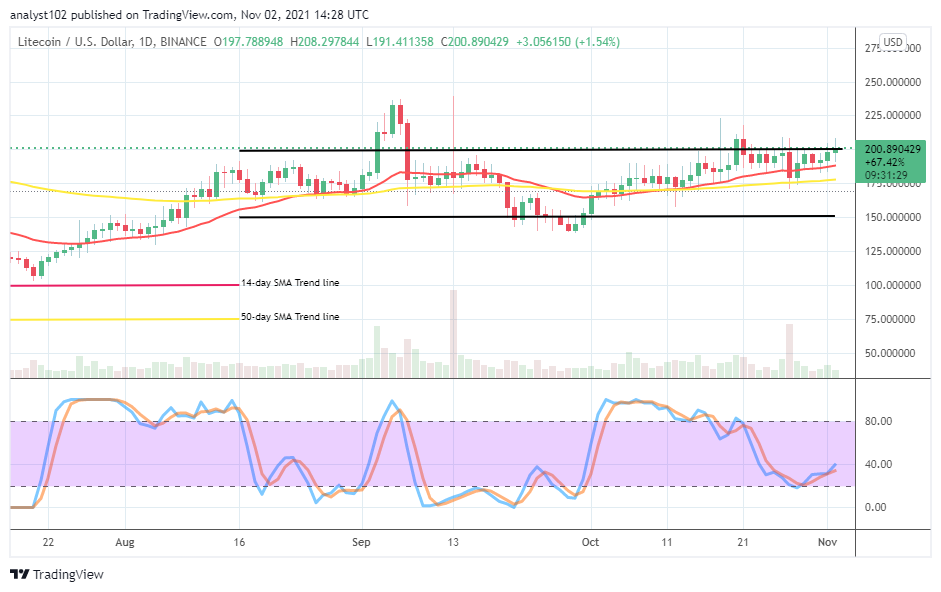
There is a kind of a range-bound trading situation yet plays out in the LTC/USD market activities as the crypto-economic price fluctuates around the $200 level. The market records a lower point around $191 as of writing, trading around the value line earlier mentioned at a positive percentage rate of 1.54.
LTC/USD Market
Key Levels:
Resistance levels: $225, $250, $275
Support levels: $150, $125, $100
LTC/USD – Daily Chart
The LTC/USD daily chart showcases that the crypto’s price fluctuates around $200 at a higher range line. The 14-day SMA trend line is above the 50-day SMA trend line. And they are both in the range value-lines. The Stochastic Oscillators have slightly bent northbound between range lines of 20 and 40. That shows that the market experiences some relative buying pressures currently.
Could there be more sustainable ups as the LTC/USD price fluctuates at $200?
The pushing northward further of the market from the $200 upper range line may not achieve as the LTC/USD price fluctuates around the value level. The present trading situation appears dicey as it is a bit difficult to project what could be the subsequent direction of the market. Nevertheless, as far as the trend still features in range-bound outlook, it would be technically ideal to allow some pull-ups to get back a reversal against the line marked upper range line to launch a sell order.
On the contrary, a fearful emergence of a full-fledged bullish candlestick against the upper range line could lead the market to break through some resistances in the subsequent days’ sessions. While that sentiment plays out, the market may not stand to uphold bullish trend continuity beyond the resistance level at $250. After a while, there will be a tendency that a downward re-surfaces either in the form of correction.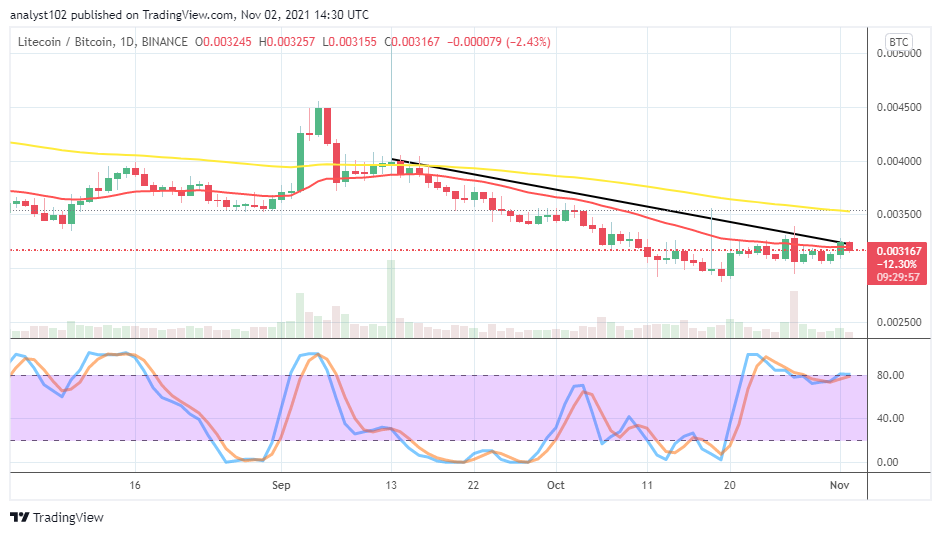
LTC/BTC Price Analysis
In comparison, the trending capability of Litecoin has been overwhelmed by Bitcoin. The cryptocurrency pair price fluctuates around the trend line of the smaller SMA. The 50-day SMA indicator is above the 14-day SMA indicator. The Stochastic Oscillators are located in the overbought region, signifying that the base crypto does not have an ideal weight to push against the flagship counter in the near sessions.
Note: Cryptosignals.org is not a financial advisor. Do your research before investing your funds in any financial asset or presented product or event. We are not responsible for your investing results.
You can purchase crypto coins here. Buy Tokens