Litecoin (LTC/USD) Price Fluctuates Between $55 and $50
Estimated Reading Time: 3 minutes
Don’t invest unless you’re prepared to lose all the money you invest. This is a high-risk investment and you are unlikely to be protected if something goes wrong. Take 2 minutes to learn more

Free Crypto Signals Channel
Litecoin Price Prediction – October 11
Less-active trading moves have continued to feature in the LTC/USD market as the crypto’s price fluctuates between the $55 and $50 zones over a couple of sessions. The last several hours into today’s trading happenings have a high of $52.65 and a low of $51.29, maintaining a negative minute rate point of 0.52%.
LTC/USD Market
Key Levels:
Resistance levels: $60, $65, $70
Support levels: $50, $45, $40
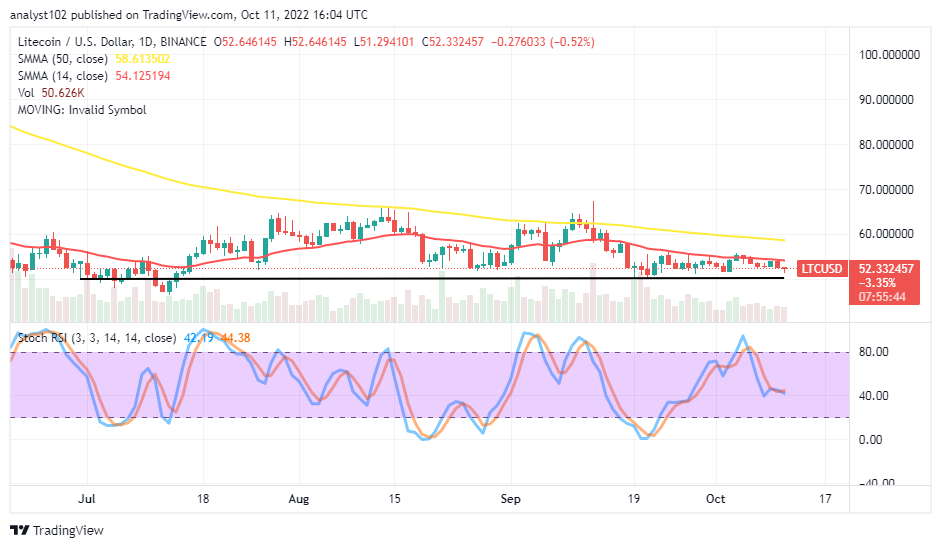
LTC/USD – Daily Chart
The daily chart showcases the LTC/USD market price fluctuates between the $55 and $50 value lines where the smaller SMA and the horizontal line are. The 14-day SMA indicator is at $54.13, beneath the $58.61 value point of the 50-day SMA indicator. The Stochastic Oscillators have traveled southbound from the overbought region closely above the range of 40 to keep 44.38 and 42.19 range values. That signifies there’s a relatively downward-moving motion in place.
Will the LTC/USD trading operations continue to decrease toward the $50 support on the downside?
Even though the current trading stature of the LTC/USD market portends that a declining motion is in place, the situation appears, trying to give a better chance to bulls to find support as the price fluctuates between $55 and $50 trading points. By constantly scanning for a test and a potential rebound-moving mode from the lower value, time can save if long-position placers execute a buying limit order around the spot.|
On the downside of the technical analysis, though, a selling force seems to be in place as the gravitational weight may soon lose the stances of sustainability. The trade may regain strength closely above the $50 support level as it averages the point to the downside. It would be a good habit to make the Stochastic Oscillators the yardstick to determine the range pace the market will follow to the south side.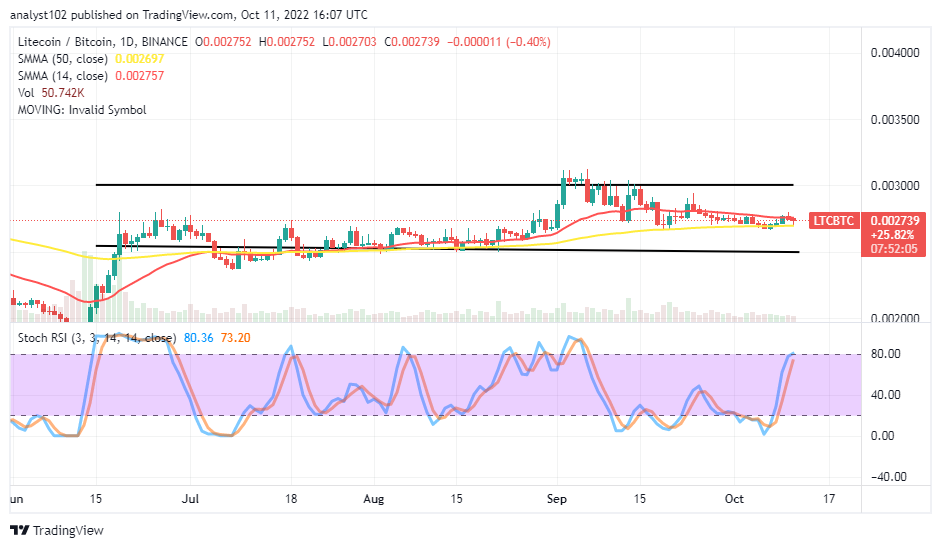
LTC/BTC Price Analysis
In comparison, Litecoin’s trending mode has been in the high-range boundaries within which the trend lines of the SMAs kept. The 14-day SMA indicator is above the 50-day SMA indicator. And they are near points to each other. The stochastic oscillators have jumped northward from the oversold area to range values between 73.20 and 80.36 to cross their lines in the direction of the downward trend. It shows the former crypto may still relatively debases for a while against the counter-trading crypto.
Note: Cryptosignals.org is not a financial advisor. Do your research before investing your funds in any financial asset or presented product or event. We are not responsible for your investing results.
You can purchase Lucky Block here. Buy LBLOCK