Litecoin (LTC/USD) Price Increases for Recovery
Estimated Reading Time: 3 minutes
Don’t invest unless you’re prepared to lose all the money you invest. This is a high-risk investment and you are unlikely to be protected if something goes wrong. Take 2 minutes to learn more

Free Crypto Signals Channel
Litecoin Price Prediction – March 22
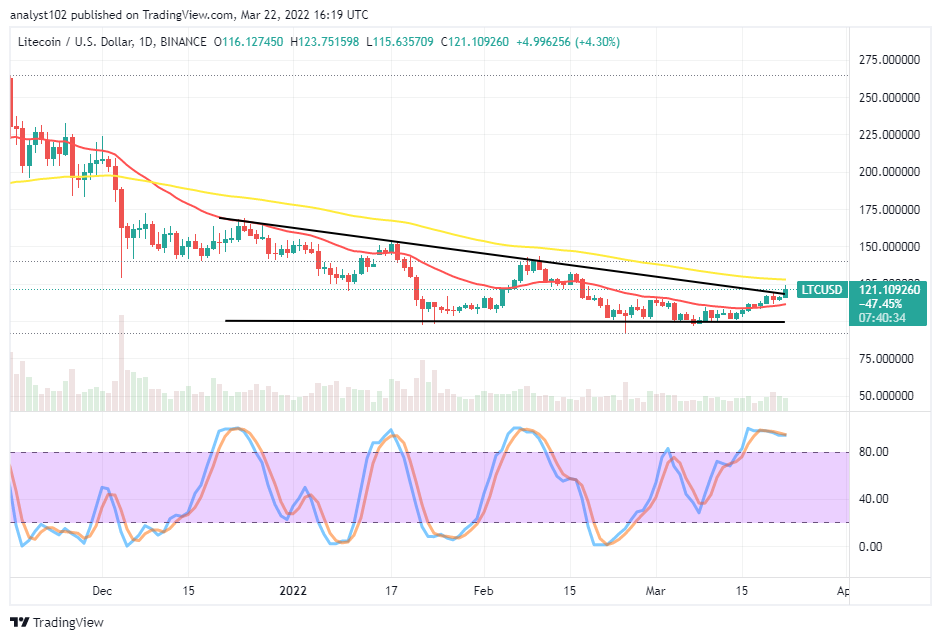
On this note, the LTC/USD market price increases stance for a recovery as the crypto economy has been downing against the US Dollar over a long-term trading session. The increasing motion has witnessed a high of $123 and a low of $115, trading around $121 at a positive percentage of 4.30.
LTC/USD Market
Key Levels:
Resistance levels: $125, $135, $145
Support levels: $110, $105, $100
LTC/USD – Daily Chart
The LTC/USD daily chart reveals the crypto-economic market price increases for recovery from a downward-trending force faced over time. The 50-day SMA indicator is closely above the $125 resistance level as the 14-day SMA indicator is underneath it. A smaller bullish candlestick is in the making against the trend line below the bigger SMA. The Stochastic Oscillators are in the overbought region in a conjoined order within. And they signify a consolidation movement is ongoing.
Should traders expect more ups over the probable trait of the LTC/USD trade returning to a selling force as the crypto-economic price increases for a recovery?
More ups may still feature in the LTC/USD trade operations over the probable trait of the crypto economy returning to selling based on account of currency trading in an overbought zone as indicated by a powerful trading tool. The crypto’s price increases for recovery as there has been no visible sign of losing the momentum. However, the trading outlook suggests there may soon be an exhaustion of the pressures to the upside. That sounds a warning note to long-position placers to be wary of new buying execution at that moment.
On the downside of the technical analysis, the LTC/USD market short-position placers may start to watch out for a rejection toward or around the $125 resistance level to consider a re-launch of the sell order. Smaller bearish candlesticks of about two or three around the 50-day SMA trend line as positioned southwardly could confirm that a selling force will likely occur in no time.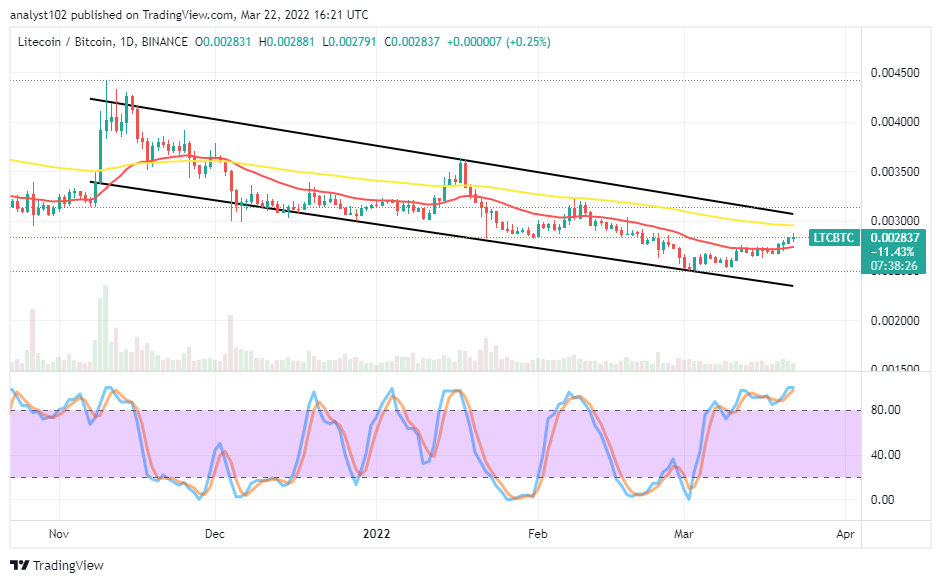
LTC/BTC Price Analysis
In comparison, Litecoin pushes against Bitcoin in well-defined bearish channel trend lines. In other words, the cryptocurrency market price increases for recovery within the bearish channels. The 14-day SMA is underneath the 50-day SMA. And they are pointing to the south side. The Stochastic Oscillators are in the overbought region, moving in a consolidation manner. That signifies the flagship countering crypto has slightly lost the pushing power against its base crypto. There is a tendency for a falling force to return in the near time.
Note: Cryptosignals.org is not a financial advisor. Do your research before investing your funds in any financial asset or presented product or event. We are not responsible for your investing results.
You can purchase Lucky Block here. Buy LBlock:


