Litecoin (LTC/USD) Price Resumes a Rally
Estimated Reading Time: 3 minutes
Don’t invest unless you’re prepared to lose all the money you invest. This is a high-risk investment and you are unlikely to be protected if something goes wrong. Take 2 minutes to learn more

Free Crypto Signals Channel
Litecoin Price Prediction – September 27
Recently, sellers’ reactions have been exhausted, having touched around as the LTC/USD price resumes a rally from the point of $50. The last fewer hours have witnessed the market trading between $55 and $53 at an average positive percentage rate of 2.57.
LTC/USD Market
Key Levels:
Resistance levels: $60, $65, $70
Support levels: $50, $45, $40
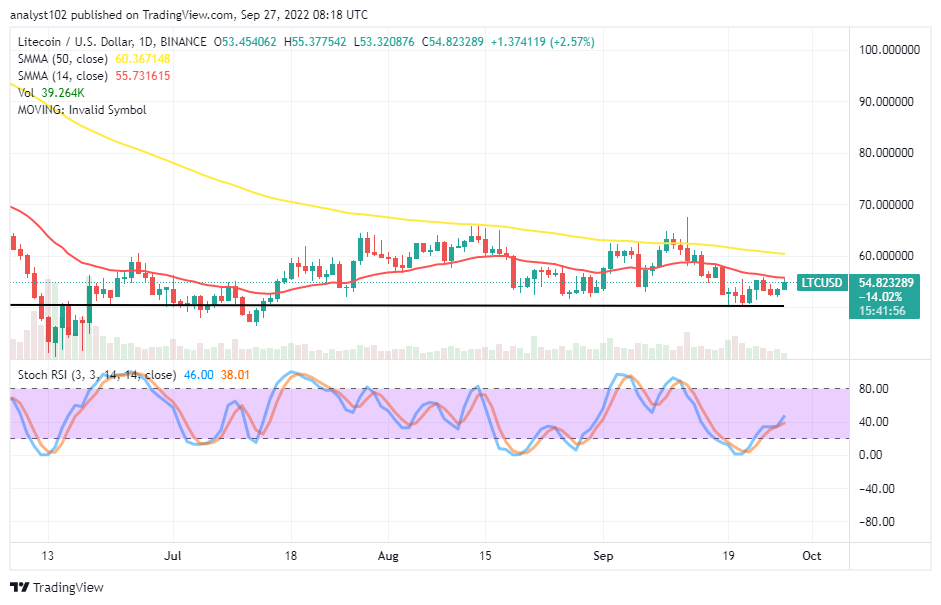
LTC/USD – Daily Chart
Today’s LTC/USD daily chart showcases the crypto market price resumes a rally from the $50 support level. Variant candlesticks are being formed closely beneath the sell signal side of the smaller SMA, making an effort to breach it northward. The 14-day SMA indicator is at $55.73, beneath the $60.34 value line of the 50-day SMA indicator. The Stochastic Oscillators have moved northbound from the oversold region to 38.01 and 46..00 range values to depict that an upward motion is in relative progress.
Can there be more ups in the LTC/USD market from its current trading spot?
There can be more ups in the LTC/USD market operations as the crypto’s price resumes a rally from the $50 support trading level. Presently, the market has to breach past the barrier-trading point around the trend line of the 14-day SMA to obtain the maximal points of the current rallying force. On the average rating, buyers still have about 54% to push northwardly from its current trading spot.
On the downside of the technical analysis, selling activities may have to be suspended until another round of rejections surfaces at a high-resistance trading zone of the $60 level. Short-position placers can place a sell limit order around the value line to save the time of watching or monitoring the movement to the area. The stop loss order that will use need not be lesser than around the $70 level. But investors still have to allow the market to run on a long-term basis and continue to buy from the dips.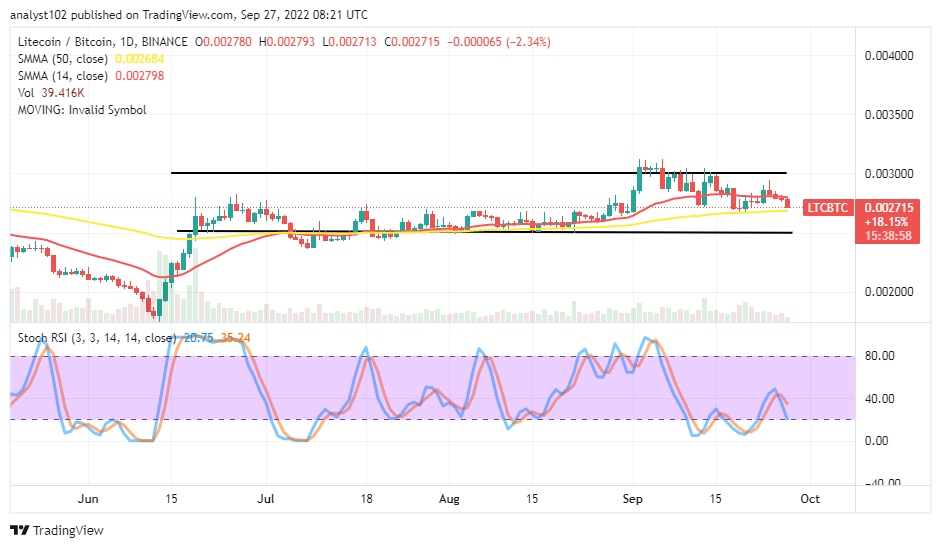 LTC/BTC Price Analysis
In comparison, Litecoin currently retraces downward at a higher-ranging spot. The range-bound channels are to ascertain the zone that price has been keeping around the trend lines of the SMAs. The 14-day SMA is above the 50-day SMA indicator. The Stochastic Oscillators have crossed southbound against the range of 40 to reach 35.24 and 20.75 range values. That indicates the base crypto is under declining pressure, pairing with the trending ability of the counter-crypto. However, the trending force may not keep for a long time.
Note: Cryptosignals.org is not a financial advisor. Do your research before investing your funds in any financial asset or presented product or event. We are not responsible for your investing results.
You can purchase Lucky Block here. Buy LBLOCK