Litecoin (LTC/USD) Price to Lose a Catalyst, Pushing Near $100
Estimated Reading Time: 3 minutes
Don’t invest unless you’re prepared to lose all the money you invest. This is a high-risk investment and you are unlikely to be protected if something goes wrong. Take 2 minutes to learn more
Litecoin Price Prediction – May 16
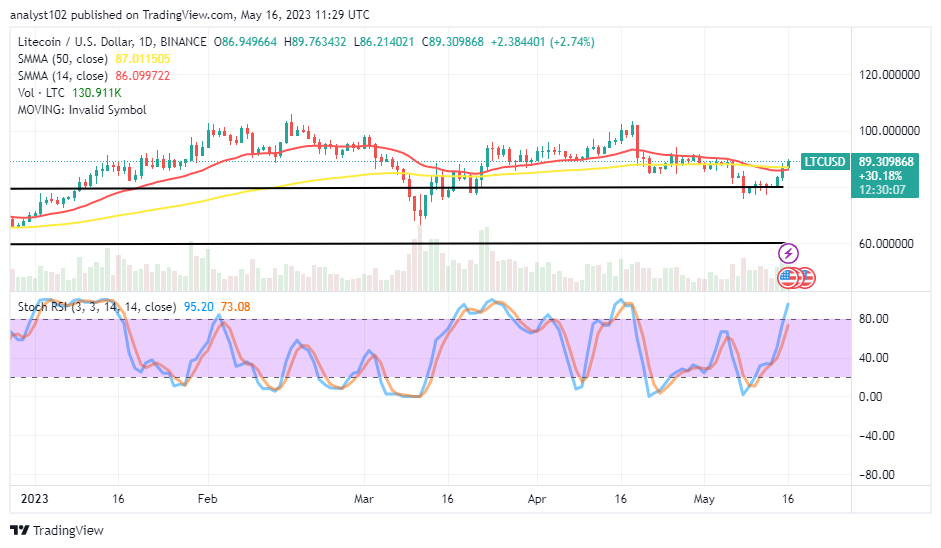
There has been a tendency for the LTC/USD market to lose a catalyst, as the crypto-economic operations are currently pushing near the $100 resistance. The percentage rate of the motions is at 2.74, leaving the price to trade between $86.214021 and $89.763432 trade zones in positives. Buyers needed to protect their stances that might have opened around $75 with a trailing stop order. And they should be wary of letting the positions in the phase of a significant reversal mode.
LTC/USD Market
Key Levels:
Resistance levels: $100, $105, $110
Support levels: $85, $80, $75
LTC/USD – Daily Chart
The LTC/USD daily chart reveals the crypto-economic price may lose a catalyst, pushing near the resistance of $100 in the long run. The 14-day SMA indicator bent slightly to the north, closely beneath the 50-day SMA. Yesterday, a bullish candlestick was created via this area, causing the price to rise to its current level of $89.309868. An overbought circumstance is rapidly coming because the stochastic oscillators are headed north at 73.08 and 95.20.
As the price of the LTC/USD market gets closer to $100, are any reliable buy entries available right now?
Going by an ideal technical trading approach ethics, it is not ideal to launch a buy order in the LTC/USD market operations as it has been that the crypto-economic price is pushing near the resistance of $100. The buying cycle is currently at the point of fatigue, which will make it unnecessary to place additional orders for long positions.
On the losing-moving direction of the LTC/USD trade technical analysis, short-position placers be alert when a bearish candlestick emerges following a rejection at a high point near or around the $100 resistance line before launching a shorting order. And another look at the trading approach is that if today’s session turns to produce a bearish candlestick against the SMA trend lines, bears will systemically capitalize the path to get some reduction points against the $75 support line afterward.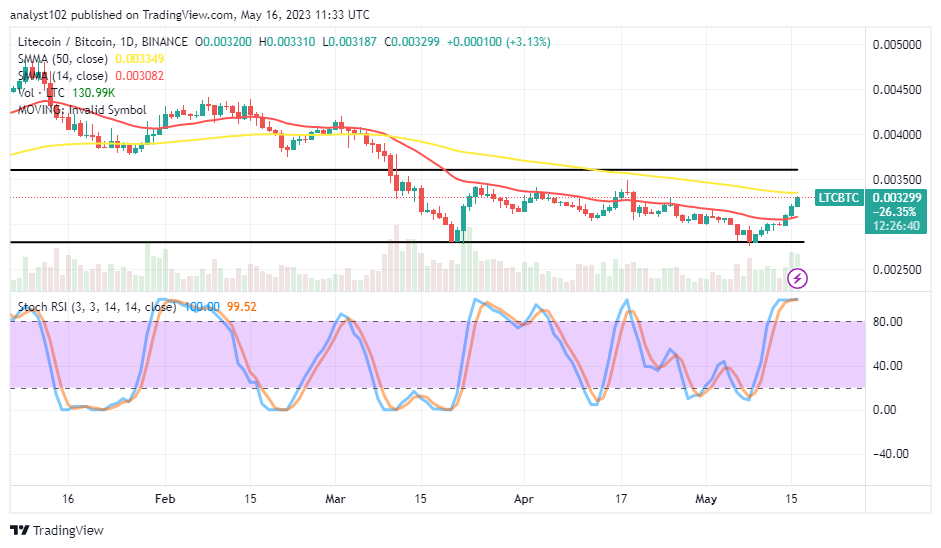
LTC/BTC Price Analysis
In contrast, Litecoin trading activities have been rising against Bitcoin under a bearish trading setting around the bigger SMA trend line. The pairing cryptocurrency market may lose a catalyst, pushing near a high point in the well-defined range-bound spots over time. The 50-day SMA indicator is over the 14-day SMA indicator. The Stochastic Oscillators are in the overbought region, keeping 99.52 and 100 levels. The base crypto is presently pushing in the mood of heading toward completion.
Note: Cryptosignals.org is not a financial advisor. Do your research before investing your funds in any financial asset or presented product or event. We are not responsible for your investing results.
You can purchase Lucky Block here. Buy LBLOCK