Litecoin (LTC/USD) Trade Holds a Downside Below the Indicators
Estimated Reading Time: 3 minutes
Don’t invest unless you’re prepared to lose all the money you invest. This is a high-risk investment and you are unlikely to be protected if something goes wrong. Take 2 minutes to learn more

Free Crypto Signals Channel
Litecoin Price Prediction – April 12
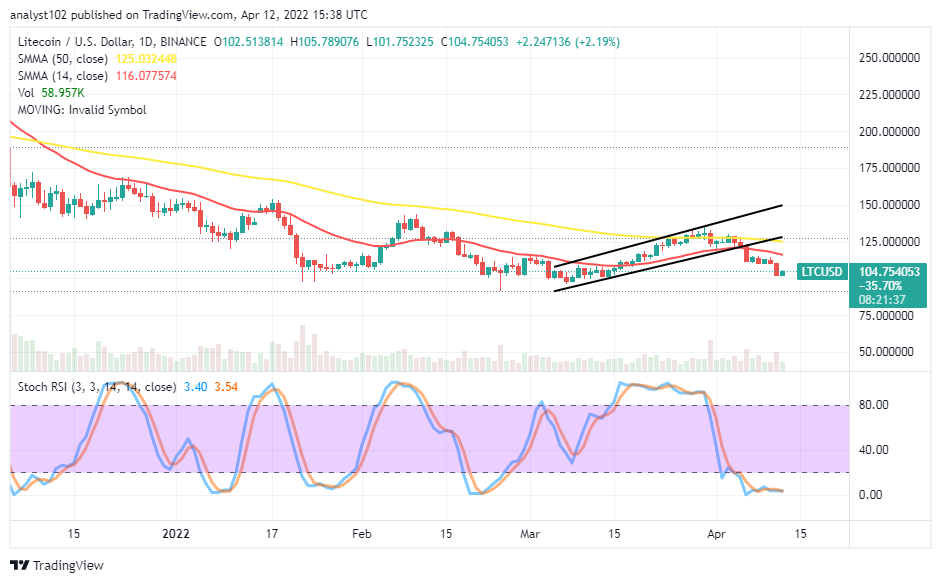
The LTC/USD trade operation holds a downside below all the trading indicators, having satisfied some upward rallying forces lately. There has been an increase in the crypto valuation against the US Dollar as price features between $105 and $101, at a positive percentage rate of 2.19 over the last several hours back.
LTC/USD Market
Key Levels:
Resistance levels: $120, $130, $140
Support levels: $100, $90, $80
LTC/USD – Daily Chart
The LTC/USD daily chart exhibits the crypto-economic trade holds a downside below the indicators as the price tries to find support around the $100 support level. The 50-day SMA trend line is above the 14-day SMA trend line. A bearish candlestick that emerged yesterday has reached the ultimate critical lower trading spot to suggest an uglier condition toward getting a bearish motion continuation. To validate that analytics opinion, the Stochastic Oscillators are down in the oversold region with their lines clogged together within to indicate a change in the downing moves put on by the market recently.Will the LTC/USD market dips down more than the $100 lower level as the crypto trade holds a downside below the indicators?
If more dips down beyond the $100 lower level occur, there will be firmer stances for the LTC/USD market bulls to rebuild upon as the crypto-economic trade holds a downside below the indicators. It may take a while for the market to gain a re-occurrence of variant upward swings away from the value line. But, as it is, it is opined that traders should be nursing the biased mind of looking for a decent buy entry.
On the downside of the technical analysis, the LTC/USD market bears have once again pushed the crypto economy down into a lower trading zone that signifies exhaustion of the bearish trend. Therefore, it is not technically ideal that shorting orders will run into profiteering. It would be okay for sellers to exit some of the positions that might have opened to run from around $125 and $130 levels in the previous sessions to avoid total loss back to the market.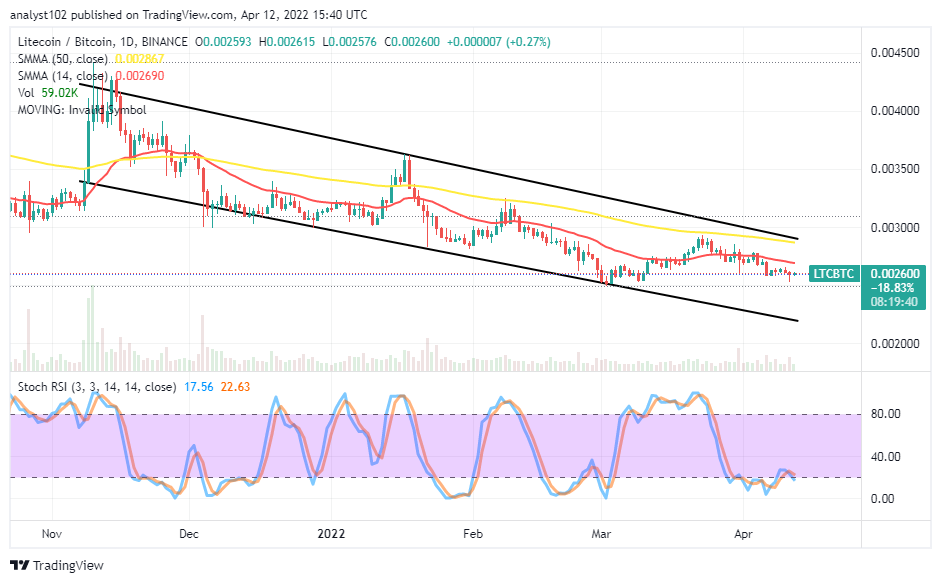 LTC/BTC Price Analysis
In comparison, Litecoin remains downing against the trending catalyst of Bitcoin. The cryptocurrency pair trade holds a downside below the SMA trend lines. The 50-day SMA indicator is above the 14-day SMA indicator. The Stochastic Oscillators are consolidating around the range of 20 and partly in the oversold region to signify the base crypto is yet to get its position firm against the flagship counter crypto.
Note: Cryptosignals.org is not a financial advisor. Do your research before investing your funds in any financial asset or presented product or event. We are not responsible for your investing results.
You can purchase Lucky Block here. Buy LBlock: