Lucky Block Price Prediction: LBLOCK/USD Becomes Cheap; More Buyers Are to Play Out
Estimated Reading Time: 3 minutes
Don’t invest unless you’re prepared to lose all the money you invest. This is a high-risk investment and you are unlikely to be protected if something goes wrong. Take 2 minutes to learn more
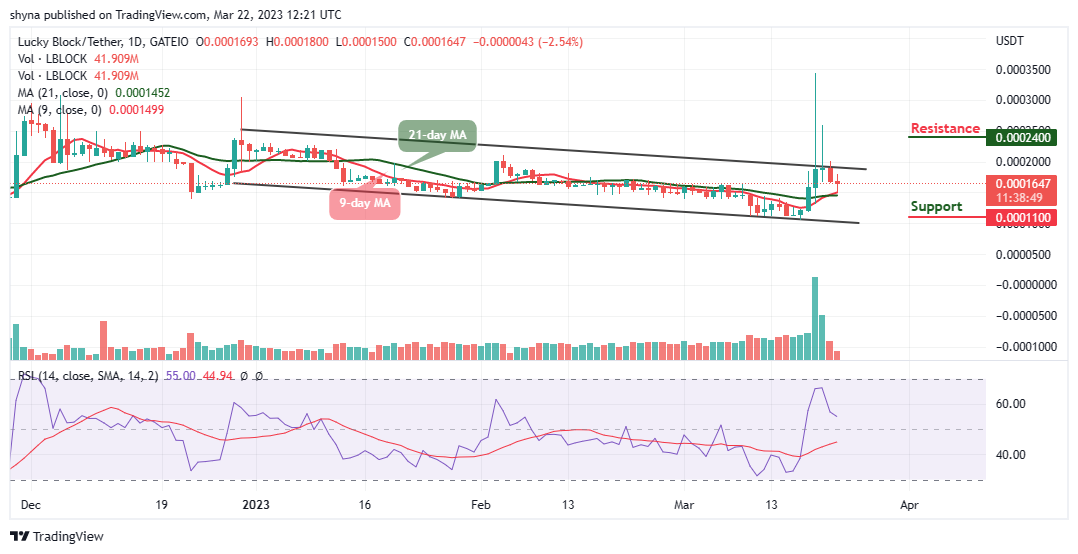
Lucky Block Price Prediction – March 22
The Lucky Block price prediction shows that LBLOCK is above the moving averages but more buyers are expected to come into the market soon.
LBLOCK/USD Medium-term Trend: Ranging (1D Chart)
Key Levels:
Resistance levels: $0.000240, $0.000260, $0.000280
Support levels: $0.000110, $0.000090, $0.000070
Looking at the daily chart, LBLOCK/USD is still trading above the 9-day and 21-day moving averages; this is for the market price to prepare for another bullish movement. However, the buyers are gathering momentum for new investors to come into the market.
Lucky Block Price Prediction: LBLOCK/USD Will Head to the Upside
The Lucky Block price touches the daily low at $0.000150 but as soon as the 9-day moving average breaks above the 21-day moving average, the coin is expected to begin the upward movement. Therefore, any further bullish movement above the upper boundary of the channel will hit the resistance levels of $0.000240, $0.000260, and $0.000280 respectively.
On the other hand, the market can still go cheap if the bears increase the selling pressure, sliding toward the lower boundary of the channel can cause the coin to hit the supports at $0.000110, $0.000090, and $0.000070. Meanwhile, the technical indicator Relative Strength Index (14) is yet to cross below the 50-level, buyers are expected to buy the dips as the coin will begin to move upward.
LBLOCK/USD Medium-term Trend: Ranging (4H Chart)
On the 4-hour chart, the Lucky Block price is ready to break above the 9-day and 21-day moving averages. The long-term moving averages will keep the bullish movement as the market is starting a new trend in the next positive direction. Moreover, as soon as the buyers push the price toward the upper boundary of the channel, a higher resistance level could be located at $0.000230 and above.
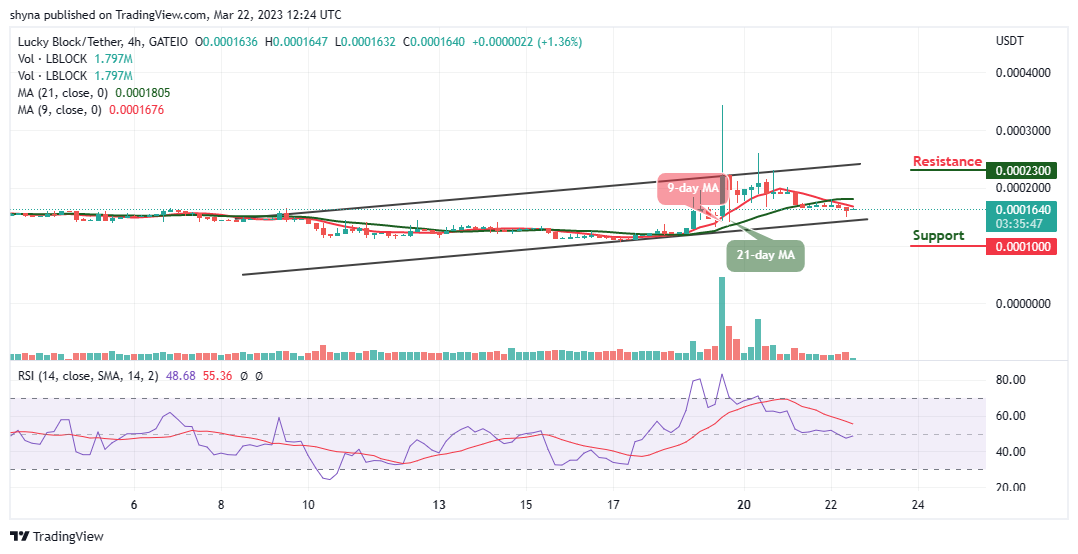
Meanwhile, the technical indicator Relative Strength Index (14) is moving to cross above the 50-level, indicating that the coin will begin to move higher. Should the bulls fail to move the coin higher, sellers may step into the market, and the nearest support level could be located at $0.000100 and below.
You can purchase Lucky Block here. Buy LBLOCK