Lucky Block Price Prediction: LBLOCK/USD Becomes Cheap; Time to Buy the Dip
Estimated Reading Time: 3 minutes
Don’t invest unless you’re prepared to lose all the money you invest. This is a high-risk investment and you are unlikely to be protected if something goes wrong. Take 2 minutes to learn more

Free Crypto Signals Channel
The Lucky Block price prediction shows that LBLOCK is set to reach a high level of $0.0007 as the coin prepares for the bullish movement.
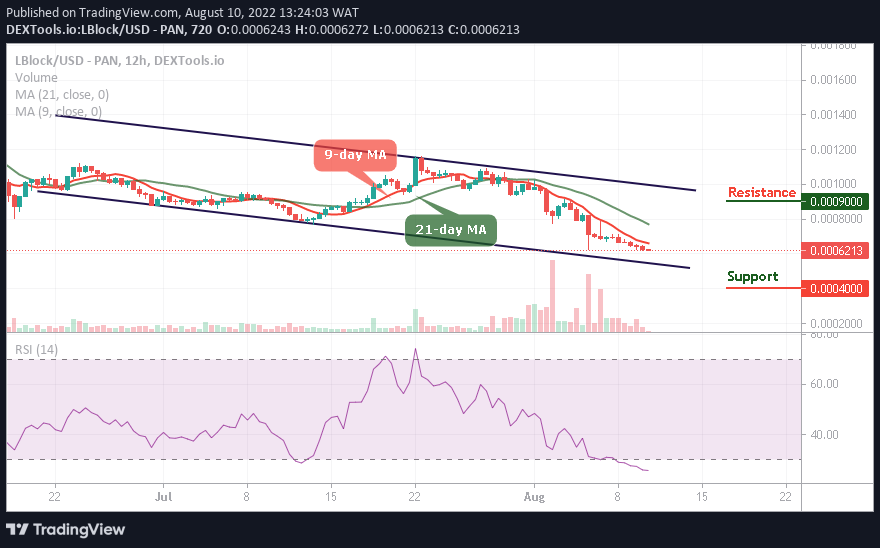
LBLOCK/USD Medium-term Trend: Bearish (12H Chart)
Key Levels:
Resistance levels: $0.0009, $0.0010, $0.0011
Support levels: $0.0004, $0.0003, $0.0002
According to the chart, after a series of both bullish and bearish movements, LBLOCK/USD will be moving to the upside soon. However, the coin will commence an upward move if the current support level at $0.0006 holds. Therefore, if the sellers push the market further lower, the support level of $0.0005 can be touched.
Lucky Block Price Prediction: LBLOCK/USD Will Resume Uptrend
The Lucky Block price is in a bearish trend zone on the higher time frame. The coin is seen below the 9-day and 21-day moving averages at the $0.00062 level as the 4-hourly chart opens today, this means that the bulls are coming into the market gradually to take over the market. On the contrary, the sellers could bring the coin into the support levels of $0.0004, $0.0003, and $0.0002.
However, the market value of Lucky Block is still trading at $0.00062 as the journey to the north will soon begin. Moreover, if the buyers hold the current market value and push it to cross above the 9-day and 21-day moving averages, the bulls will break towards the upside, and any further bullish movement will hit the resistance levels at $0.0015, $0.0017, and $0.0019 respectively.
LBLOCK/USD Medium-term Trend: Bearish (4H Chart)
The LBLOCK/USD is moving to cross above the 9-day and 21-day moving averages. The market value at $0.00064 high level will head to the upside as the 4-hourly chart opens today which affirms the presence of bulls coming into the market in an outstanding style.
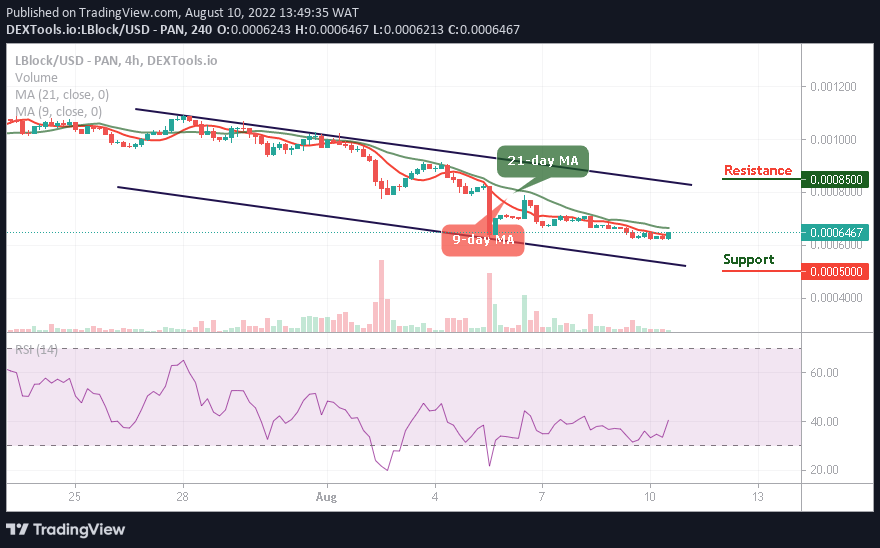
However, the Relative Strength Index (14) is pointing upward as the signal line moves to cross above the 40-level, suggesting that the bulls are set to take the price action up to a significant level of $0.00085 and above as we expect the traders to turn to the bullish market soon in the medium-term view. But any bearish movement below the channel could hit the support at $0.0005 and below.
You can purchase Lucky Block here. Buy LBLOCK