Lucky Block Price Prediction: LBLOCK/USD Becomes Cheaper; Best Time to Buy
Estimated Reading Time: 3 minutes
Don’t invest unless you’re prepared to lose all the money you invest. This is a high-risk investment and you are unlikely to be protected if something goes wrong. Take 2 minutes to learn more

Free Crypto Signals Channel
The Lucky Block price prediction drops below the 9-day and 21-day moving averages; the price becomes cheaper for new buyers to enter the market.
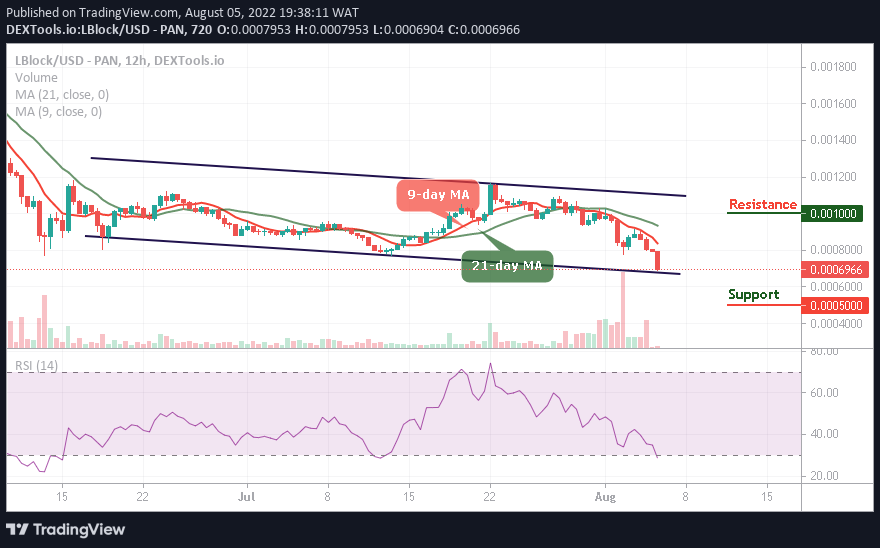
LBLOCK/USD Medium-term Trend: Ranging (12H Chart)
Key Levels:
Resistance levels: $0.0010, $0.0011, $0.0012
Support levels: $0.0005, $0.0004, $0.0003
LBLOCK/USD gets ready for a bullish movement as the coin slides below $0.0007. This is necessary for the coin to gain access to the higher resistance levels and for the existing buyers to buy the dip. However, if the sellers push the market further lower, bears can expect immediate support to be located below the lower boundary of the channel.
Lucky Block Price Prediction: LBLOCK/USD Will Head for a Retracement
The Lucky Block price will cross above the 9-day and 21-day moving averages as the coin prepares for the bullish movement, but the current movement will be a good opportunity for the existing buyers to buy the dip. Moreover, the technical indicator Relative Strength Index (14) moves to cross into the oversold region for it to reach the supports at $0.0005, $0.0004, and $0.0003.
In other words, if the buyers hold the current market value and push it to the upside, the bulls can expect to above the 9-day and 21-day moving averages and any further bullish movement may hit the resistance levels at $0.0010, $0.0011, and $0.0012.
LBLOCK/USD Medium-term Trend: Ranging (4H Chart)
On the 4-hour chart, the Lucky Block (LBLOCK) is moving towards the 9-day and 21-day moving averages as the coin heads toward the upper boundary of the channel, which could give the new and existing buyers to buy more.
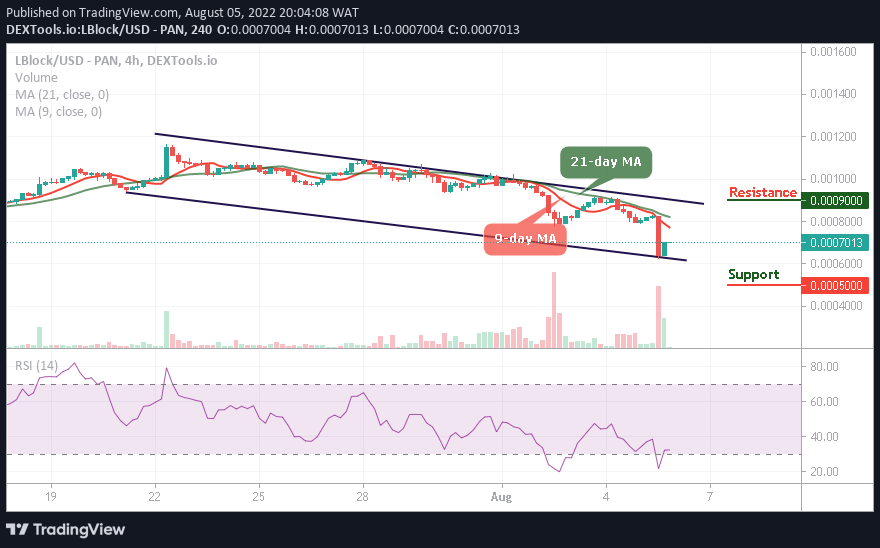
From above, buyers are gaining momentum as they head to the upside; higher resistance could be located above the upper boundary of the channel at $0.0009 and above. Therefore, any bearish movement below the channel could hit the support level at $0.0005 and below while the technical indicator Relative Strength Index (14) moves out of the oversold region.
You can purchase Lucky Block here. Buy LBLOCK