Lucky Block Price Prediction: LBLOCK/USD Begins the Upward Movement as Price Hits $0.000097
Estimated Reading Time: 3 minutes
Don’t invest unless you’re prepared to lose all the money you invest. This is a high-risk investment and you are unlikely to be protected if something goes wrong. Take 2 minutes to learn more
Lucky Block Price Prediction – August 22
The Lucky Block price prediction reveals that the bulls will begin to increase their entries as the price gets ready for the north.
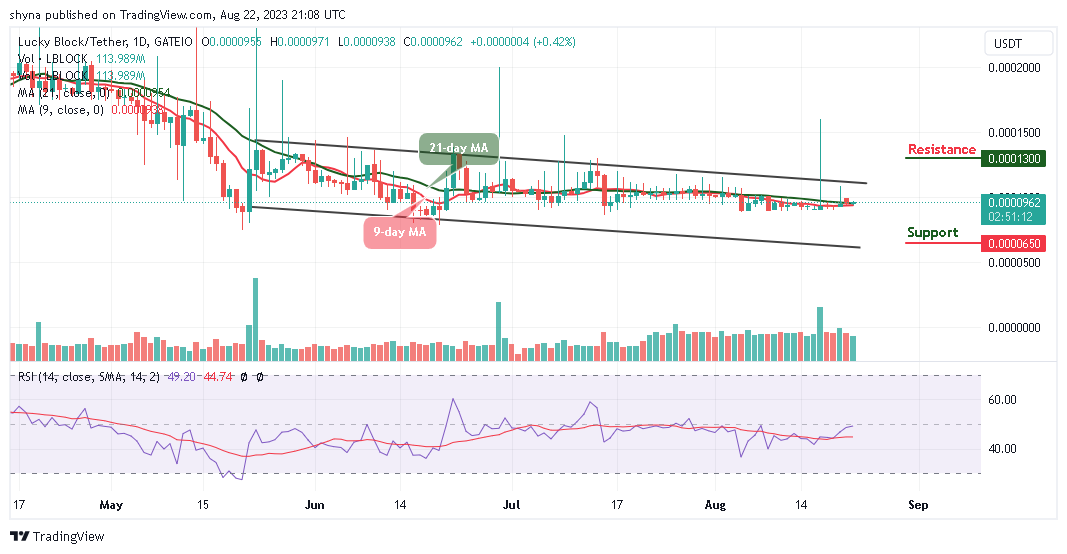
LBLOCK/USD Medium-term Trend: Ranging (1D Chart)
Key Levels:
Resistance levels: $0.000130, $0.00140, $0.000150
Support levels: $0.000065, $0.000055, $0.000045
LBLOCK/USD is beginning to move bullishly as the coin trades above the 9-day and 21-day moving averages. However, the bullish momentum is coming to play in the market, and the bullish pressure could break the $0.000100 level if the increased pressure. Meanwhile, if the bulls fail to drive the price higher, the Lucky Block price may continue to consolidate before gaining additional profit.
Lucky Block Price Prediction: LBLOCK/USD Heads to the Upside
The Lucky Block price is changing hands at $0.000096 where it will head toward the upper boundary of the channel. Moreover, if the coin crosses above the channel, LBLOCK/USD would locate the potential resistance levels at $0.000130, $0.000140, and $0.000150 while the support levels could be found at $0.000065, $0.000055, and $0.000045 respectively. This is because new buyers can come into the market as the technical indicator Relative Strength Index (14) moves to cross above the 50-level.
LBLOCK/USD Medium-term Trend: Ranging (4H Chart)
After crossing above the 9-day and 21-day moving averages, the Lucky Block retreats below the daily high of $0.000097 level. Meanwhile, the technical indicator Relative Strength Index (14) will confirm the bullish movement if the signal line crosses above the 60-level. Therefore, any possible cross above the upper boundary of the channel could reach the resistance level at $0.000103 and above.
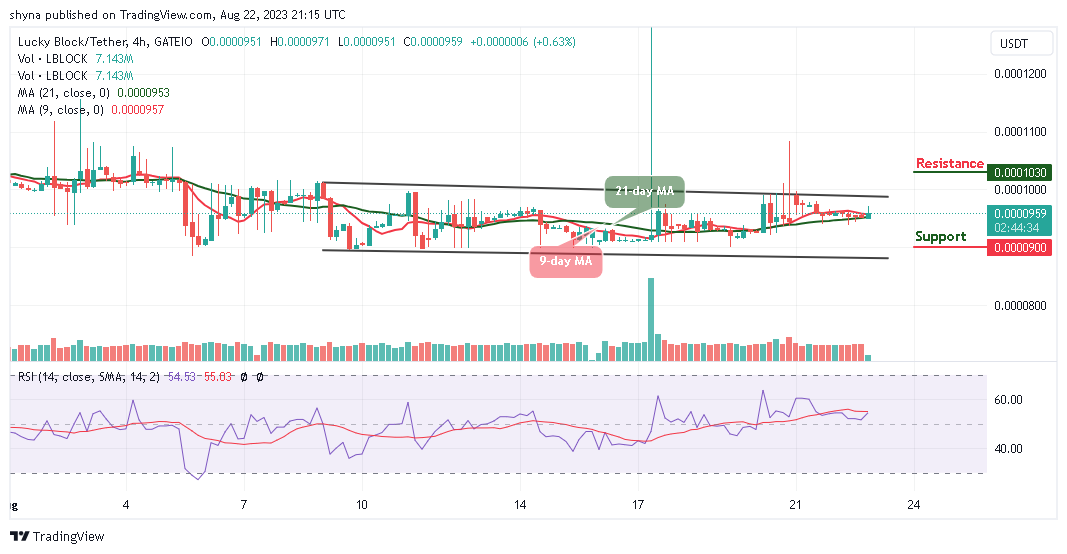
Nevertheless, LBLOCK/USD will begin to display some bullish signals as the bearish movement fades out, but if the price drops and slides and face the lower boundary of the channel, it could touch the nearest support at $0.000090 and below.
You can purchase Lucky Block here. Buy LBLOCK
