Lucky Block Price Prediction: LBLOCK/USD Bounces off to Hit $0.000165 Resistance
Estimated Reading Time: 3 minutes
Don’t invest unless you’re prepared to lose all the money you invest. This is a high-risk investment and you are unlikely to be protected if something goes wrong. Take 2 minutes to learn more
Lucky Block Price Prediction – December 27
The Lucky Block price prediction shows that LBLOCK crosses above the 9-day and 21-day moving averages to face the upside.
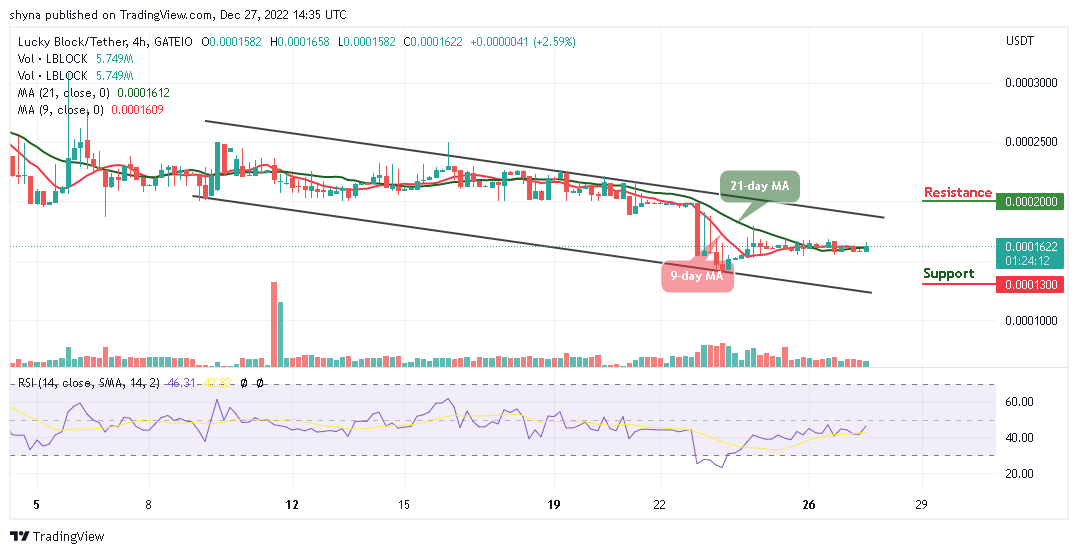
LBLOCK/USD Medium-term Trend: Ranging (4-Hour Chart)
Key Levels:
Resistance levels: $0.000200, $0.000210, $0.000220
Support levels: $0.000130, $0.000120, $0.000110
According to the 4-hour chart, LBLOCK/USD is heading to the north as the coin moves to stay strong above the 9-day and 21-day moving averages. The Lucky Block price will stable above this barrier to gain additional uptrends in the next positive direction. Meanwhile, traders are anticipating that the current price movement is an indication of the upcoming price rally in the market.
Lucky Block Price Prediction: LBLOCK/USD Begins Upward Movement
The Lucky Block price begins to move to the north, while the new buyers are expected to come into the market. LBLOCK/USD will move towards the upper boundary of the channel, any further bullish movement above the channel could hit the resistance levels of $0.000200, $0.000210, and $0.000220 respectively.
However, as the technical indicator Relative Strength Index (14) faces the north, the signal line can cross above the 50-level for the Lucky Block (LBLOCK) to sustain the bullish movement. On the contrary, if the coin retreats to the south, the support levels of $0.000130, $0.000120, and $0.000110 could be located, and this can be the best opportunity for the new investors to invest in the coin.
LBLOCK/USD Medium-term Trend: Ranging (2-Hour Chart)
On the 2-hour chart, the Lucky Block price is also facing the upside, and it is currently above the 9-day and 21-day moving averages, aiming to cross above the upper boundary of the channel. At the moment, the buyers are pushing the coin to the north while the technical indicator Relative Strength Index (14) crosses above the 50-level.
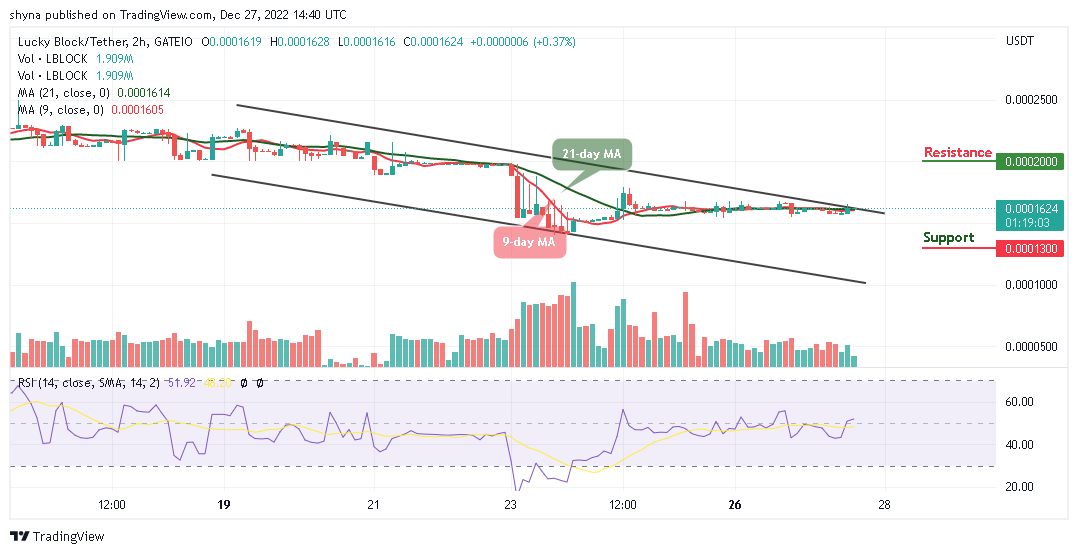
Nevertheless, if the bulls succeed in pushing the price to the upside, the Lucky Block would rise to touch the resistance level of $0.000200 and above but this could be delayed a little bit if the 9-day MA remains below the 21-day MA. Therefore, if the market heads toward the lower boundary of the channel, it could bring the price to the support level of $0.000130 and below.
You can purchase Lucky Block here. Buy LBLOCK