Lucky Block Price Prediction: LBLOCK/USD Climbs Above $0.000030
Estimated Reading Time: 3 minutes
Don’t invest unless you’re prepared to lose all the money you invest. This is a high-risk investment and you are unlikely to be protected if something goes wrong. Take 2 minutes to learn more
Lucky Block Price Prediction – October 4
The Lucky Block price prediction is showing positive signs as LBLOCK heads to the upside, suggesting further higher levels.
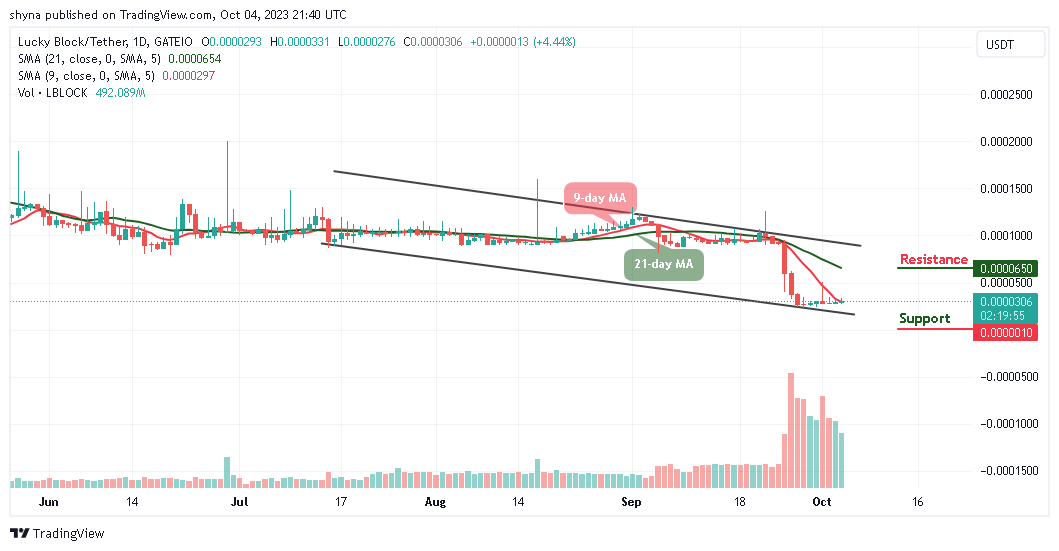
LBLOCK/USD Long-term Trend: Bearish (1D Chart)
Key levels:
Resistance Levels: $0.000065, $0.000067, $0.000069
Support Levels: $0.0000010, $0.0000008, $0.000006
LBLOCK/USD climbs above the resistance level of $0.0000300 as the new month’s high may beckon. The Lucky Block price sets its eye on $0.000050, and the coin will continue to enjoy a sharp uptrend as long the crypto can keep this trend up.
Lucky Block Price Prediction: Lucky Block Price Could Spike to the North
The Lucky Block price is trading comfortably toward the 21-day moving average as the price establishes a new bullish signal. At the moment, traders could say that the current price movement may favor the bulls, any further bullish movement could reach the resistances at $0.000065, $0.000067, and $0.000069 respectively.
On the contrary, any drop from the current level could lead to declines in the critical support below the lower boundary of the channel. However, in case LBLOCK drops and revisits the low of $0.000027 support, then the coin can rely on the long-term support levels at $0.0000010, $0.000008, and $0.000006.
LBLOCK/USD Medium-term Trend: Ranging (4H Chart)
According to the 4-hour chart, the Lucky Block price is seen trading within the 9-day and 21-day moving averages at $0.000030. However, the coin moves to cross above the channel, and as it climbs above the long-awaited resistance level of $0.000050 with a sharp upsurge. On that note, LBLOCK/USD could begin to maintain its bull run if the 9-day MA crosses above the 21-day MA.
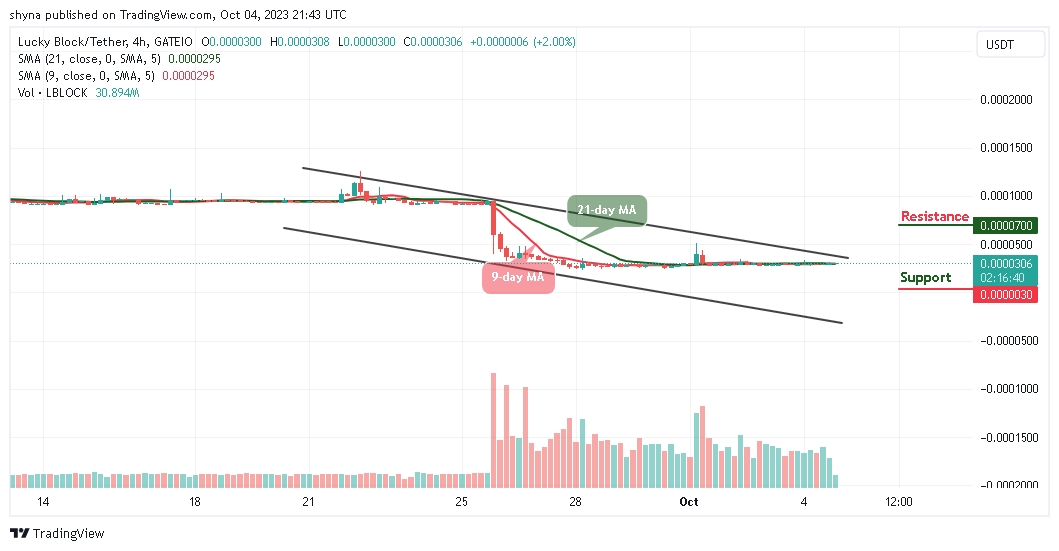
In other words, LBLOCK may take a downward move if the bulls fail to push the price higher, and the coin may breach below the 9-day and 21-day moving averages, which could hit the support at $0.000003 and below. Nevertheless, if the bulls find a decent resistance level of above $0.000050, LBLOCK/USD may cross above the channel which could hit the resistance level of $0.000070 and above.
You can purchase Lucky Block here. Buy LBLOCK