Lucky Block Price Prediction: LBLOCK/USD Continues to Move Higher; Price Touches $0.000259 Level
Estimated Reading Time: 2 minutes
Don’t invest unless you’re prepared to lose all the money you invest. This is a high-risk investment and you are unlikely to be protected if something goes wrong. Take 2 minutes to learn more
Lucky Block Price Prediction – March 20
The Lucky Block price prediction is moving to cross above the upper boundary of the channel for confirmation of the bullish movement.
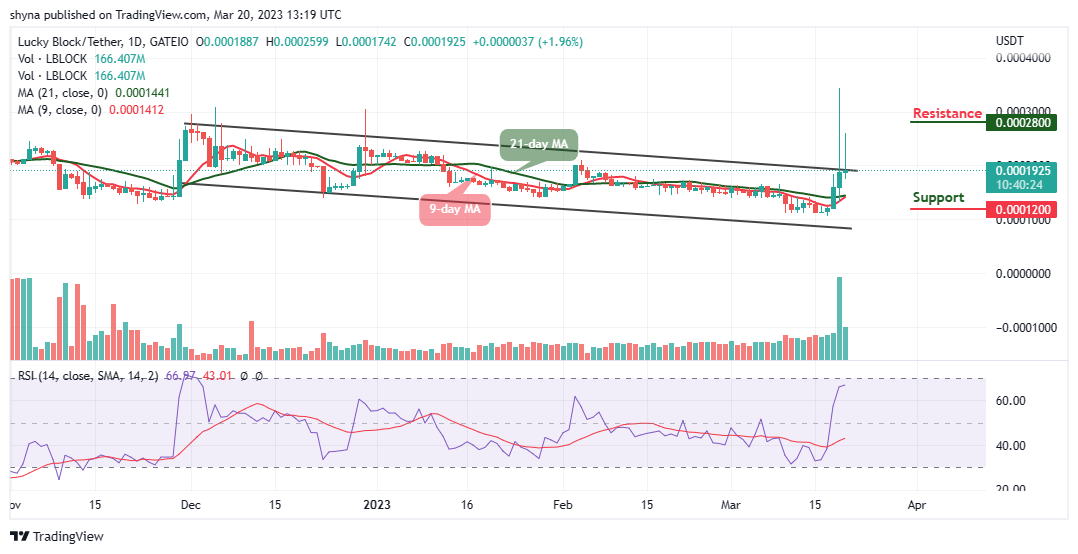
LBLOCK/USD Medium-term Trend: Bullish (1D Chart)
Key Levels:
Resistance levels: $0.000280, $0.000300, $0.000320
Support levels: $0.000120, $0.000100, $0.000080
LBLOCK/USD is trading well above the 9-day and 21-day moving averages as the coin crosses above the upper boundary of the channel. Looking at the daily chart, the Lucky Block price will begin to maintain an upward movement as traders anticipate the current price movement indicating the upcoming price rally in the market.
Lucky Block Price Prediction: LBLOCK/USD Heads to the Positive Side
As the Lucky Block price remains above the 9-day and 21-day moving averages, the coin will claim the resistance level of $0.000260 to hit the potential resistance levels of $0.000280, $0.000300, and $0.000320. Meanwhile, as the technical indicator Relative Strength Index (14) moves to cross into the overbought region, the Lucky Block will continue to gain additional uptrends. But, if the bulls failed to push the coin to the north, the support levels of $0.000120, $0.000100, and $0.000080 can come into play.
LBLOCK/USD Medium-term Trend: Bearish (4H Chart)
The Lucky Block price is still above the 9-day and 21-day moving averages, and the coin is ready to cross above the upper boundary of the channel. However, the technical indicator Relative Strength Index (14) remains above the 60-level as the existing buyers are expected to dominate the market.
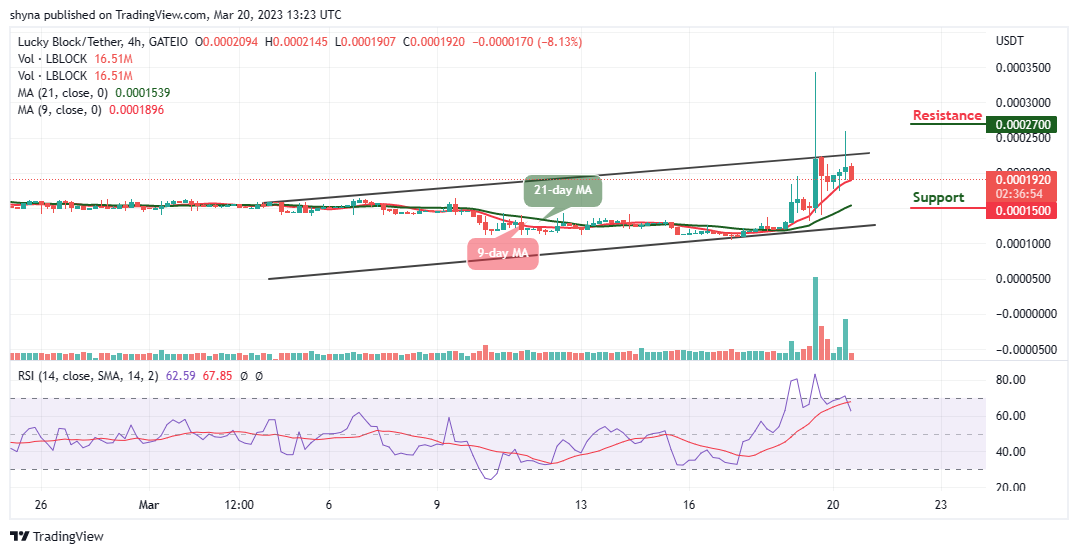
However, if the bulls push the market price above the upper boundary of the channel, the Lucky Block will hit the potential resistance level of $0.000270 and above. On the contrary, if the coin heads to the south and crosses below the 9-day moving average, it can locate the support level at $0.000150 and below.
You can purchase Lucky Block here. Buy LBLOCK