Lucky Block Price Prediction: LBLOCK/USD Could Break Above $0.000030 Level
Estimated Reading Time: 3 minutes
Don’t invest unless you’re prepared to lose all the money you invest. This is a high-risk investment and you are unlikely to be protected if something goes wrong. Take 2 minutes to learn more
Lucky Block Price Prediction – May 29
The Lucky Block price prediction is anticipated to ascend as the coin prepares for a surge above the moving averages, indicating potential upward momentum.
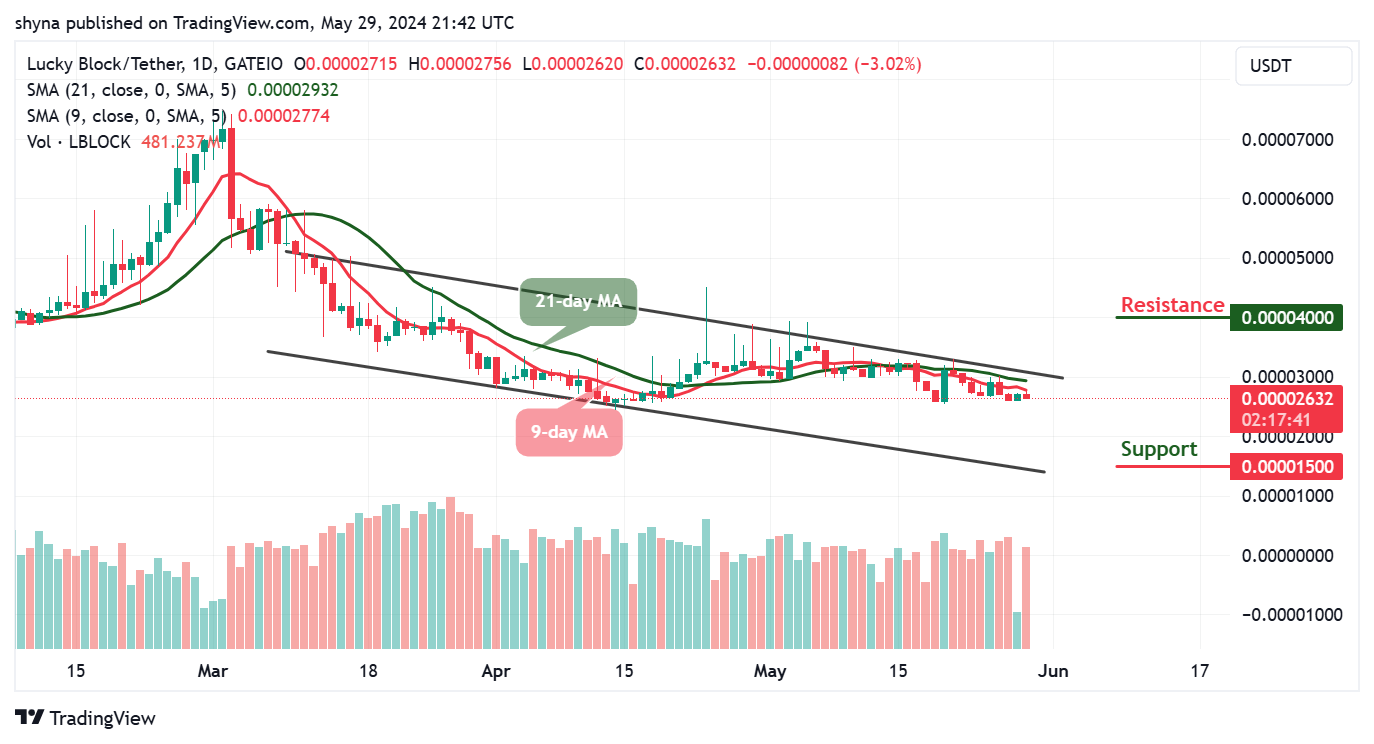
LBLOCK/USD Medium-term Trend: Bearish (1D Chart)
Key Levels:
Resistance levels: $0.000040, $0.000042, $0.000044
Support levels: $0.000015, $0.000013, $0.000011
According to the chart, LBLOCK/USD appears to be trending bearishly as the market price approaches the 9-day and 21-day moving averages. Currently hovering around the $0.000026 level, the coin shows signs of potential bullish momentum as it nears the previous resistance level of $0.000027. However, if the bulls are unable to sustain upward pressure, there might be a consolidation phase, creating an opportunity for new buyers to enter the market.
Lucky Block Price Prediction: LBLOCK/USD May Consolidate Before Breaking Higher
Following a dip below the $0.000026 support level, the Lucky Block price has shown signs of resurgence, breaking above both the 9-day and 21-day moving averages. Should this trend continue, further bullish momentum could propel the price toward potential resistance zones at $0.000040, $0.000042, and $0.000044.
Conversely, if bearish pressure drives the price toward the lower channel boundary, support levels at $0.000015, $0.000013, and $0.000011 may come into play. Notably, the 9-day moving average remains positioned below the 21-day moving average, indicating a possible setup for bullish movements ahead.
LBLOCK/USD Medium-term Trend: Bearish (4H Chart)
Based on the 4-hour chart analysis, the Lucky Block price remains within the range below both the 9-day and 21-day moving averages, although bullish momentum appears to be building, potentially driving the coin toward the upper boundary of its trading channel. This presents an opportune moment for new investors to enter the market or reinvest.
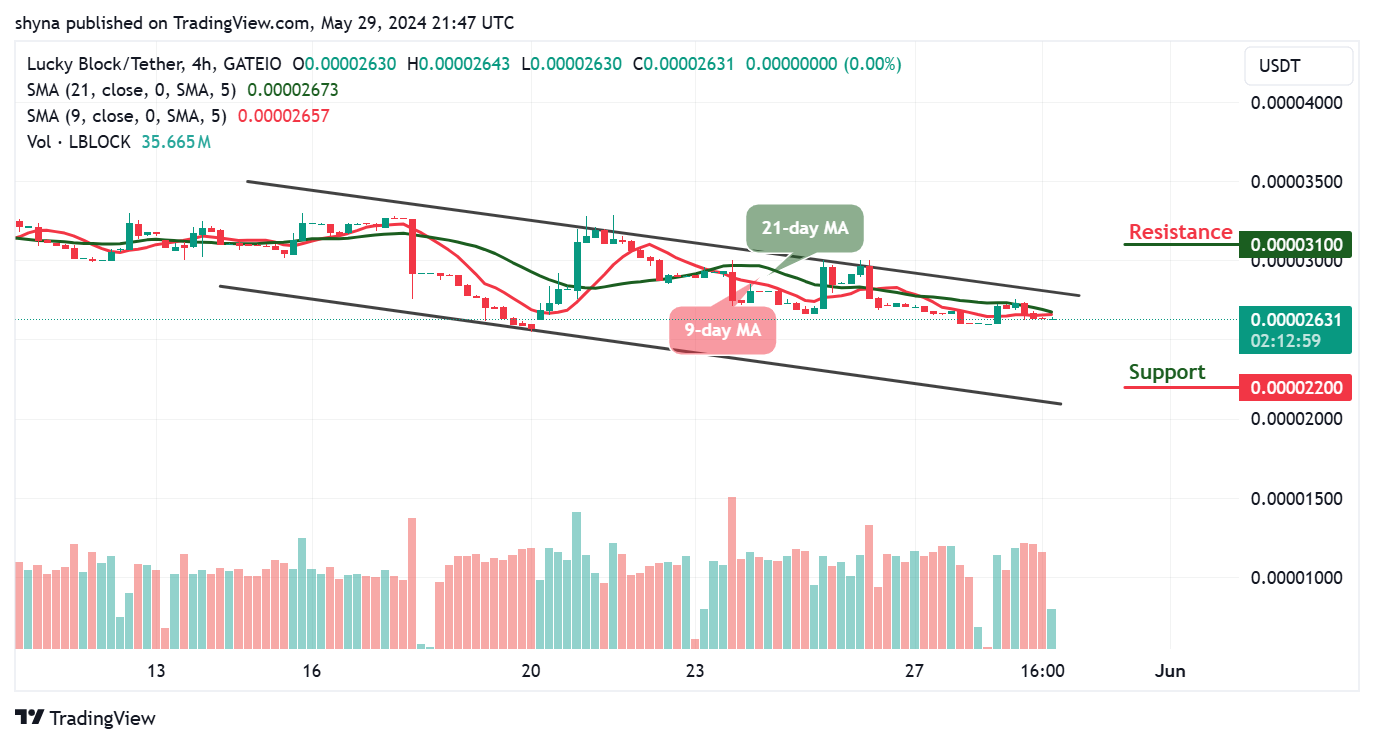
However, should buyers succeed in pushing the price above the upper boundary, a higher resistance level around $0.000031 and above could be targeted, with the possibility of a bullish cross occurring as the 9-day moving average surpasses the 21-day moving average. Conversely, if bulls fail to propel the market value beyond its current position, bears may drive the price down to the support level of $0.000022 and below.
You can purchase crypto coins here. Buy coins.