Lucky Block Price Prediction: LBLOCK/USD Could Retrace the Lost Resistance
Estimated Reading Time: 3 minutes
Don’t invest unless you’re prepared to lose all the money you invest. This is a high-risk investment and you are unlikely to be protected if something goes wrong. Take 2 minutes to learn more
Lucky Block Price Prediction – February 28
The Lucky Block price prediction breaks above the resistance level of $0.000150 as the coin faces the upside.
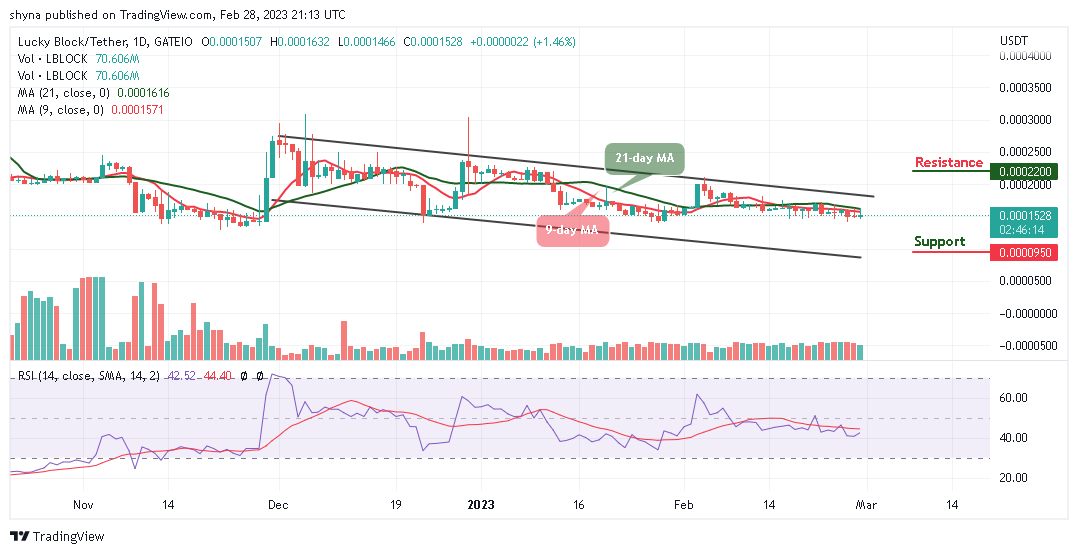
LBLOCK/USD Medium-term Trend: Bearish (1D Chart)
Key Levels:
Resistance levels: $0.000220, $0.000225, $0.000230
Support levels: $0.000095, $0.000090, $0.000085
After touching the daily low at $0.000146, LBLOCK/USD begins to retrace the losses as the coin moves to cross above the 9-day and 21-day moving averages. This movement is necessary for the entry of new investors into the market and if the sellers bring the market lower, the bears can look for immediate support around the $0.000145 level.
Lucky Block Price Prediction: LBLOCK/USD Gets Ready for a Rebound
The Lucky Block price is moving to cross above the 9-day and 21-day moving averages, it is preparing the coin for a bullish movement as this could be a good opportunity for existing buyers to reinvest. Meanwhile, the technical indicator Relative Strength Index (14) is moving above the 40-level, suggesting bullish signals for the coin.
On the contrary, if the coin follows the bearish movement, sliding toward the lower boundary of the channel could hit the supports at $0.000095, $0.000090, and $0.000085. However, should buyers push the current market of $0.000152 above the upper boundary of the channel, LBLOCK/USD could touch the potential resistance levels at $0.000220, $0.000225, and $0.000230.
LBLOCK/USD Medium-term Trend: Ranging (4H Chart)
Looking at the 4-hour chart, the Lucky Block (LBLOCK) moves within the 9-day and 21-day moving averages as buyers increase their buying pressure within the channel. However, any further bullish movement could hit the nearest resistance level at $0.000200.
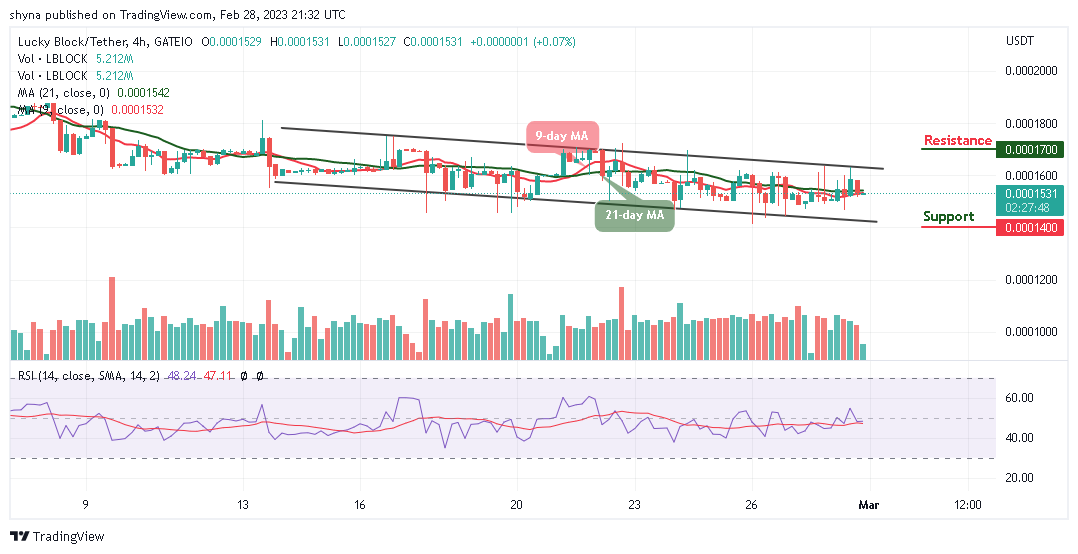
Looking at the market, the buyers are making effort to push the coin towards the upper boundary of the channel, once this is done, the coin could hit the resistance level at $0.000170 and above, but any bearish movement toward the lower boundary of the channel could touch the support at $0.000140 and below while the technical indicator Relative Strength Index (14) moves below the 50-level.
You can purchase Lucky Block here. Buy LBLOCK