Lucky Block Price Prediction: LBLOCK/USD Moves to Cross Above $0.0010 Level
Estimated Reading Time: 2 minutes
Don’t invest unless you’re prepared to lose all the money you invest. This is a high-risk investment and you are unlikely to be protected if something goes wrong. Take 2 minutes to learn more

Free Crypto Signals Channel
At the time of writing, the Lucky Block price prediction is getting ready for a cross above the moving averages as it moves to the north.
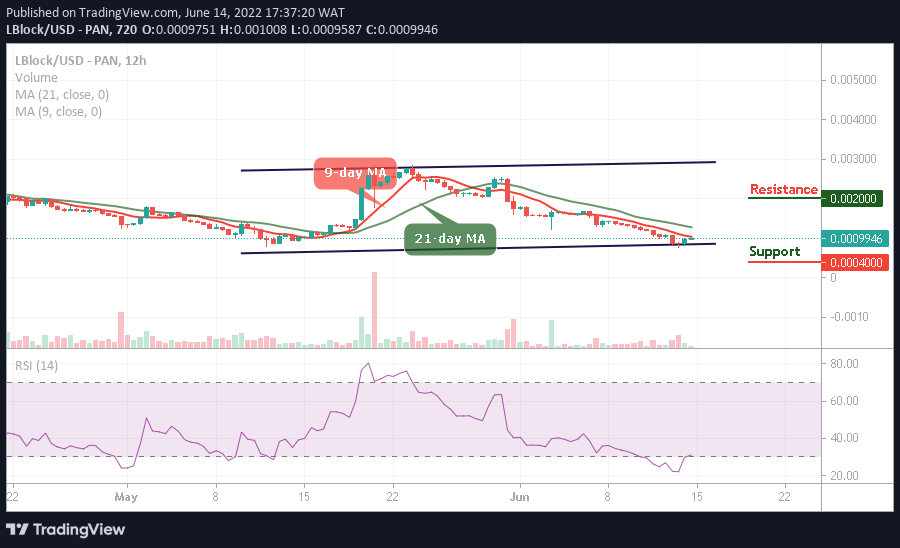
LBLOCK/USD Medium-term Trend: Ranging (12H Chart)
Key Levels:
Resistance levels: $0.0020, $0.0022, $0.0024
Support levels: $0.0004, $0.0003, $0.0001
LBLOCK/USD is heading to cross above the 9-day day moving average. Meanwhile, the bullish momentum would push the coin above the resistance level of $0.0012 to cross into the positive side.
Lucky Block Price Prediction: LBLOCK/USD Moves toward the North
The Lucky Block price is hovering at $0.0009 where it aims to cross above the 9-day moving average. However, as the coin moves to the north, it would locate the potential resistance levels at $0.0020, $0.0022, and $0.0024, while the technical indicator Relative Strength Index (14) moves above the 40-level to confirm the bullish movement. On the contrary, any bearish cross below the lower boundary of the channel may hit the supports at $0.0004, $0.0003, and $0.0001.
LBLOCK/USD Medium-term Trend: Bearish (4H Chart)
Looking at the 4-hour chart, LBLOCK/USD spikes above the 9-day and 21-day moving averages as the technical indicator Relative Strength Index (14) moves above the 40-level. Moreover, any further bullish movement above the current market value at $0.0009 will hit the resistance level at $0.0015 and above.
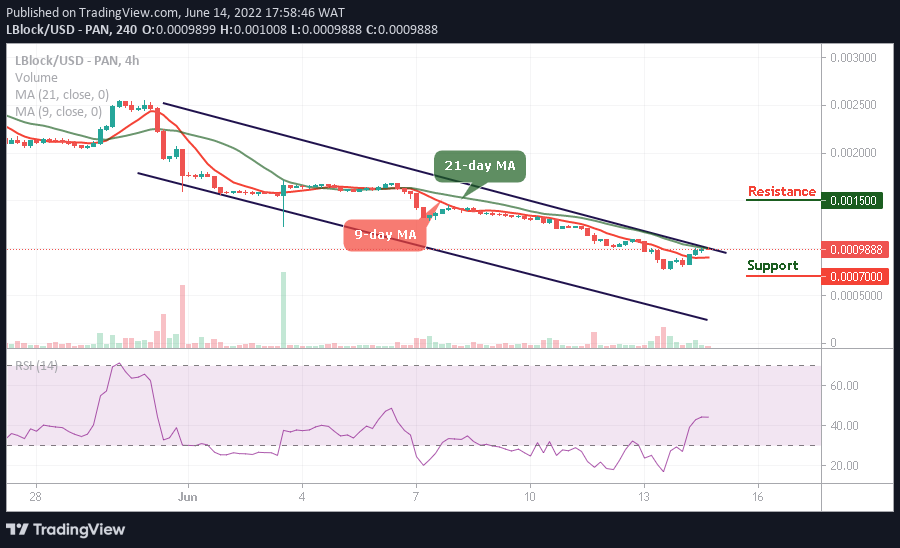
On the contrary, LBLOCK/USD may retreat below the 9-day moving average and head towards the south, once this comes to focus, it could touch the critical support at $0.0007 and below as the new buyers are expected to come into the market.
You can purchase Lucky Block here. Buy LBlock