Lucky Block Price Prediction: LBLOCK/USD Prepares for the Retracement Above $0.000220 Level
Estimated Reading Time: 2 minutes
Don’t invest unless you’re prepared to lose all the money you invest. This is a high-risk investment and you are unlikely to be protected if something goes wrong. Take 2 minutes to learn more
Lucky Block Price Prediction – December 14
The Lucky Block price prediction breaks above the resistance level of $ 0.000220 during the European session today.
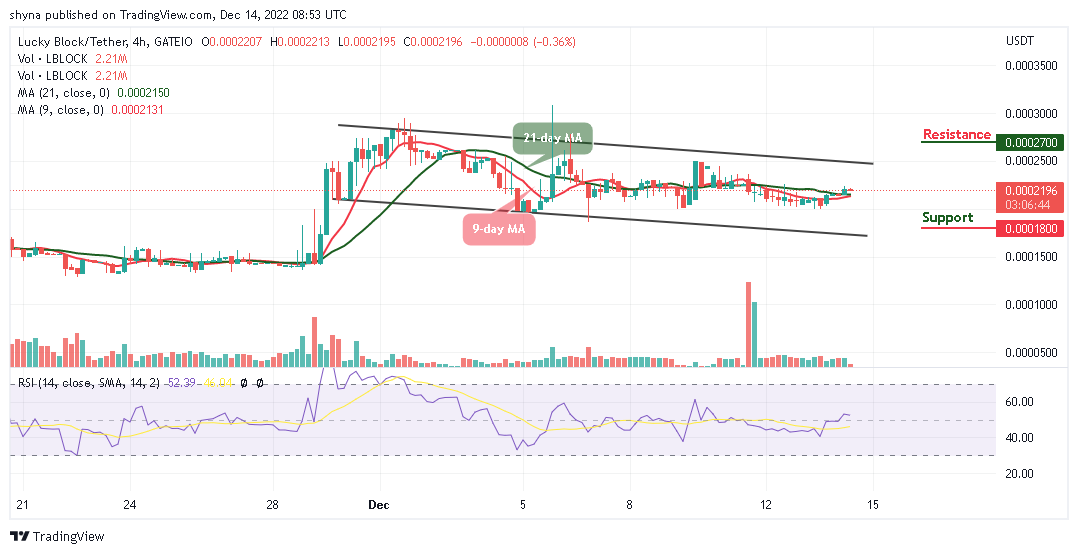
LBLOCK/USD Medium-term Trend: Ranging (4H Chart)
Key Levels:
Resistance levels: $0.000270, $0.000290, $0.000310
Support levels: $0.000180, $0.000160, $0.000140
LBLOCK/USD is preparing to move higher as the coin pulls back below $0.000220. This upward movement is necessary for the entry of new investors into the market. Therefore, if the sellers bring the market price lower, the bears can look for immediate support around the $0.000210 level.
Lucky Block Price Prediction: LBLOCK/USD Gets Ready for a Rebound
The Lucky Block price is above the 9-day and 21-day moving averages; the coin is preparing for a bullish movement, and this could be a good opportunity for the existing buyers to reinvest. Meanwhile, the Relative Strength Index (14) technical indicator is moving around above the 50-level, any bearish movement towards the lower boundary of the channel could hit the supports at $0.000180, $0.000160, and $0.000140.
On the contrary, should the buyers hold the current market at $0.000219 and could push it toward the upper boundary of the channel, the bulls can hit the potential resistance levels at $0.000270, $0.000290, and $0.000310.
LBLOCK/USD Medium-term Trend: Ranging (2H Chart)
On the 4-hour chart, the Lucky Block (LBLOCK) moves in the same direction as the buyers are coming into the market, and this could push the coin to cross above the upper boundary of the channel.
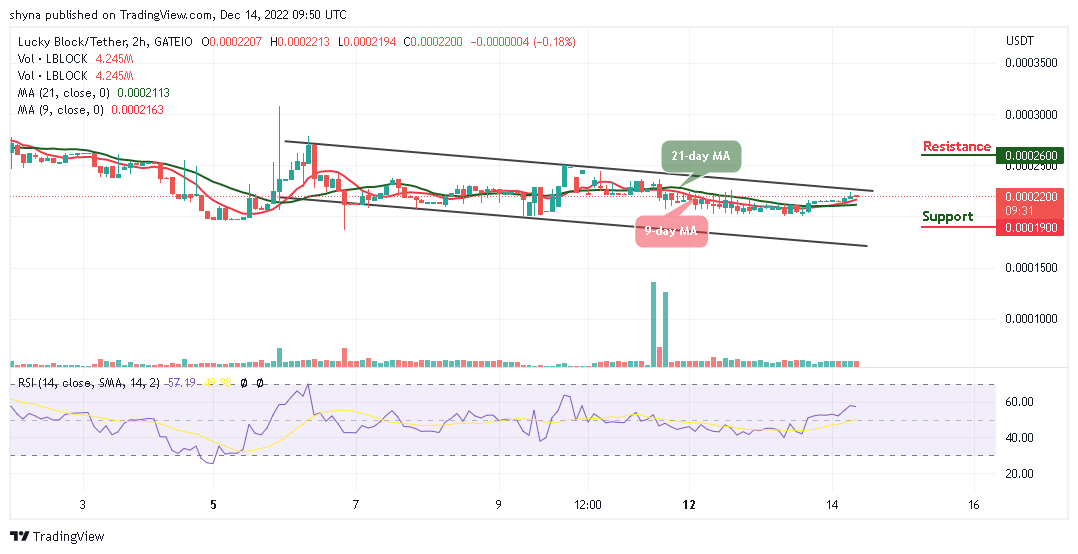
Looking at the market, the buyers are making effort to push the coin to the upside, once this is done, the coin could hit the resistance level at $0.000260 and above, but any further bearish movement could touch the support at $0.000190 and below as the technical indicator Relative Strength Index (14) remains above the 50-level.
You can purchase Lucky Block here. Buy LBLOCK