Lucky Block Price Prediction: LBLOCK/USD Retreats to Break Higher
Estimated Reading Time: 2 minutes
Don’t invest unless you’re prepared to lose all the money you invest. This is a high-risk investment and you are unlikely to be protected if something goes wrong. Take 2 minutes to learn more

Free Crypto Signals Channel
The Lucky Block price prediction stays below the 9-day moving average as the price prepares for a bullish breakout.
LBLOCK/USD Medium-term Trend: Ranging (12 Hour Chart)
Key Levels:
Resistance levels: $0.0035, $0.0040, $0.0045
Support levels: $0.0015, $0.0010, $0.0005
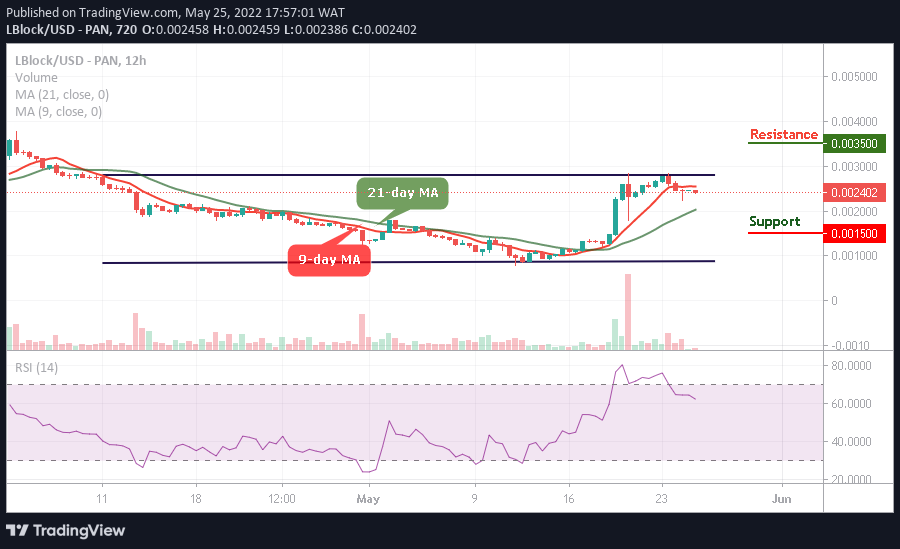
LBLOCK/USD is trading around $0.0024 as the coin gives room for the new buyers to come into the market while the existing buyers re-invest. However, if the sellers push the market further lower, they can expect immediate support to be located at the $0.0020 level.
Lucky Block Price Prediction: LBLOCK Ready for Another Spike to the North
According to the 12-hour chart, the Lucky Block price is hovering within the 9-day and 21-day moving averages. The coin could fall more if the technical indicator Relative Strength Index (14) crosses below 60-level. Any further bearish movement may locate the supports at $0.0015, $0.0010, and $0.0005.
Nevertheless, if the buyers can hold the current market value and push it above the 9-day moving average, they can then expect immediate resistance at $0.0025. However, crossing above the upper boundary of the channel, higher resistance levels may be located at $0.0035, $0.0040, and $0.0045.
LBLOCK/USD Medium-term Trend: Bullish (4 Hour Chart)
On the 4-hour chart, the Lucky Block (LBLOCK) is moving below the 9-day and 21-day moving average as the market keeps ranging and this could push the coin to cross above the 21-day moving average. LBLOCK/USD is trading at $0.0023.
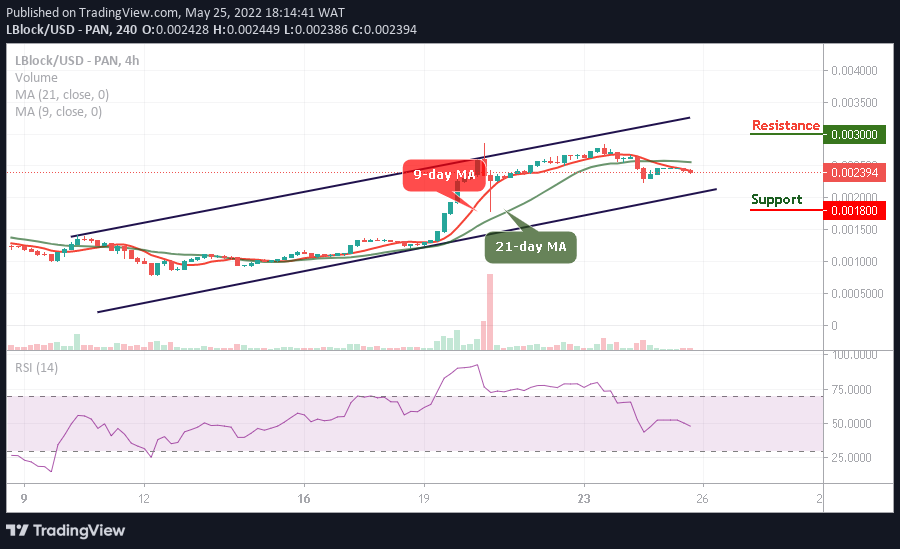
Looking at the upside, the buyers are getting ready to push the coin towards the upper boundary of the channel, higher resistance could lie at $0.0030 and above, but any further bearish movement could hit the support at $0.0018 and below as the technical indicator Relative Strength Index (14) crosses below 50-level.
You can purchase Lucky Block here. Buy LBlock