Lucky Block Price Prediction: LBLOCK/USD Spikes Above $0.000230 Level
Estimated Reading Time: 3 minutes
Don’t invest unless you’re prepared to lose all the money you invest. This is a high-risk investment and you are unlikely to be protected if something goes wrong. Take 2 minutes to learn more
Lucky Block Price Prediction – December 10
The Lucky Block price prediction shows that LBLOCK may continue to follow the bullish movement as the coin stays above the moving averages.
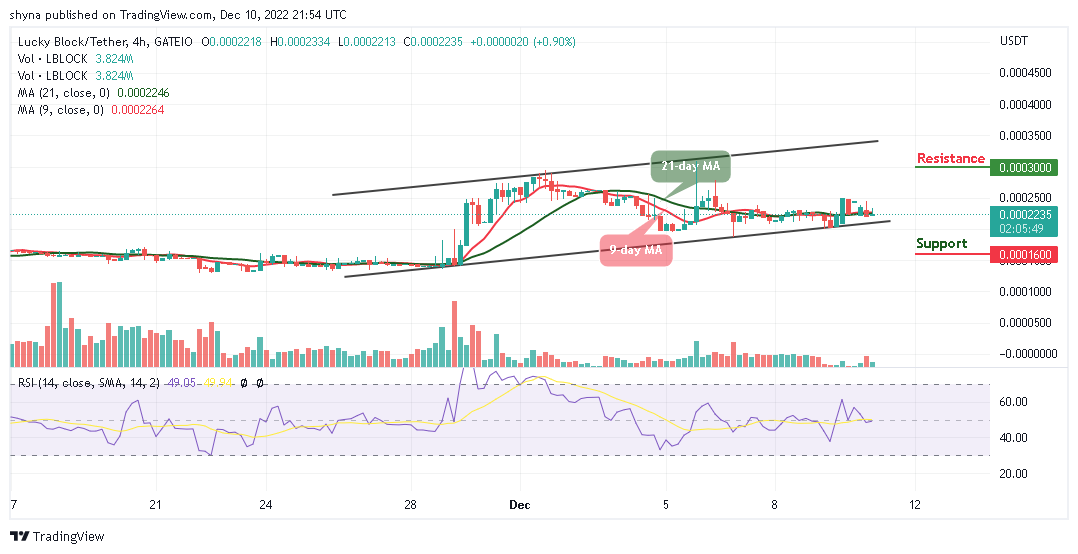
LBLOCK/USD Medium-term Trend: Ranging (1D Chart)
Key Levels:
Resistance levels: $0.000300, $0.000310, $0.000320
Support levels: $0.000160, $0.000150, $0.000140
LBLOCK/USD is moving to the upside as the coin spikes above the 9-day and 21-day moving averages. The Lucky Block price will therefore shoot to the upside to gain more upsides as traders are anticipating that the current price movement is an indication of the upcoming price rally in the market.
Lucky Block Price Prediction: LBLOCK/USD Gets Ready for More Upsides
The next step for the Lucky Block price is to reclaim back the resistance level of $0.000250; as soon as this comes to focus, bulls will cross above the moving averages to face the resistance levels of $0.000300, $0.000310, and $0.000320. However, as the technical indicator Relative Strength Index (14) moves within the 50-level if the coin retreats a little bit to the south, the support levels of $0.000160, $0.000150, and $0.000140 could be visited and it will be the best opportunity for the new buyers to come into the market.
LBLOCK/USD Medium-term Trend: Bearish (4H Chart)
On the 4-hour chart, the Lucky Block price is attempting to cross above the 9-day and 21-day moving averages; it will head toward the upper boundary of the channel. The technical indicator Relative Strength Index (14) is moving to cross above the 50-level to face the north.
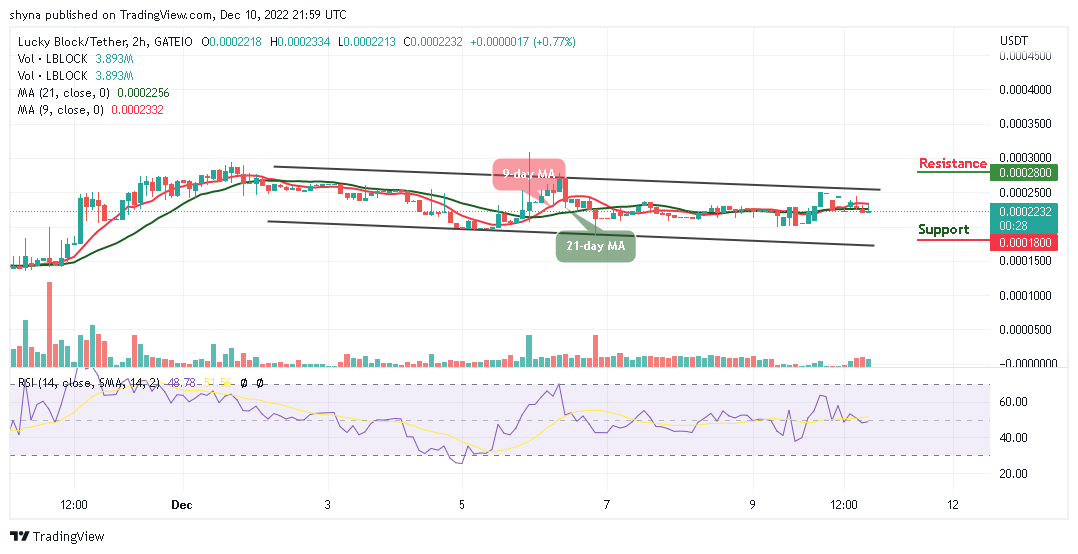
However, if the bulls push the price above the upper boundary of the channel, the Lucky Block would rise to the resistance level of $0.000280 and above, but this could be delayed if the 9-day MA slides below the 21-day MA. Therefore, this could bring the price towards the lower boundary of the channel, and staying there may cause the coin to reach the support level of $0.000180 and below while new buyers are expected to come into the market.
You can purchase Lucky Block here. Buy LBLOCK