Lucky Block Price Prediction: LBLOCK/USD Spikes Above $0.0065 Resistance
Estimated Reading Time: 3 minutes
Don’t invest unless you’re prepared to lose all the money you invest. This is a high-risk investment and you are unlikely to be protected if something goes wrong. Take 2 minutes to learn more

Free Crypto Signals Channel
The Lucky Block price prediction touches the resistance level of $0.0065 as the coin targets $0.0070 high above the moving averages.
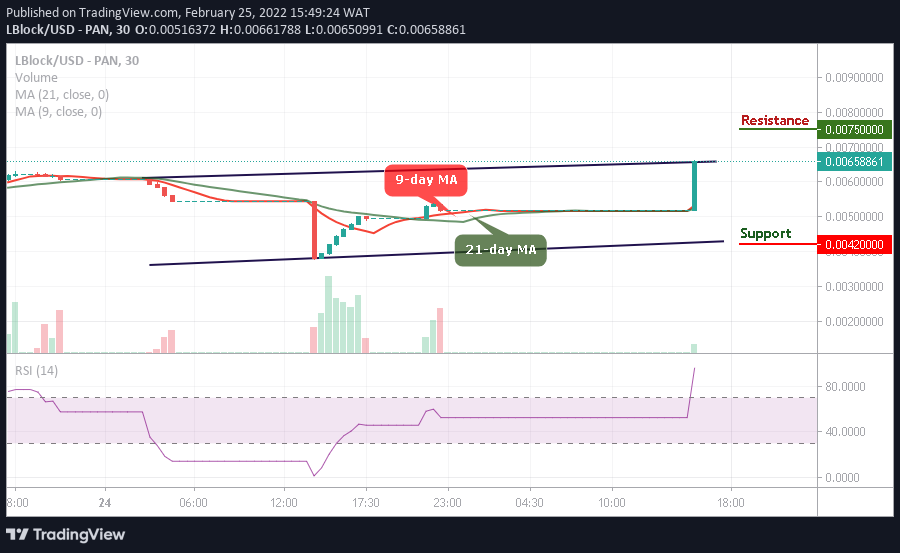
LBLOCK/USD Long-term Trend: Ranging (30 Minutes Chart)
Key Levels:
Resistance levels: $0.0075, $0.0080, $0.0085
Support levels: $0.0042, $0.0033, $0.0022
LBLOCK/USD spikes higher above the 9-day and 21-day moving averages to begin the bullish movement as the Lucky Block price crosses above the upper boundary of the channel to touch the resistance level of $0.0065 as a near $0.0070 peak would come into focus.
Lucky Block Price Prediction: LBLOCK Ready for The Upside
Looking at the 30-minute chart, traders could see that the Lucky Block price converges above the 9-day and 21-day moving averages to keep the coin at the upside. However, as the 9-day MA trend-line is crossing above the 21-day moving average to create more upsides, the technical indicator Relative Strength Index (14) is seen moving within the overbought region to sustain the bullish movement.
However, a clear break above the $0.0070 level will set the pace for increases to $0.0075, $0.0080, and $0.0085 resistance levels. Meanwhile, should the coin retreat below the $0.0050 resistance, it could start a new decline towards the support levels of $0.0042, $0.0033, and $0.0022 as the new buyers would have the opportunity to enter the market while the existing buyers will buy the dips.
LBLOCK/USD Medium-term Trend: Ranging (15 Minutes Chart)
According to the 15-minute chart, LBLOCK/USD continues to hover above the 9-day and 21-day moving averages as the market continues to show a sign of a bullish trend in the past few hours. In addition, the intraday trading is still ranging; any further bullish movement above the upper boundary of the channel could hit the resistance level of $0.0075 and above.
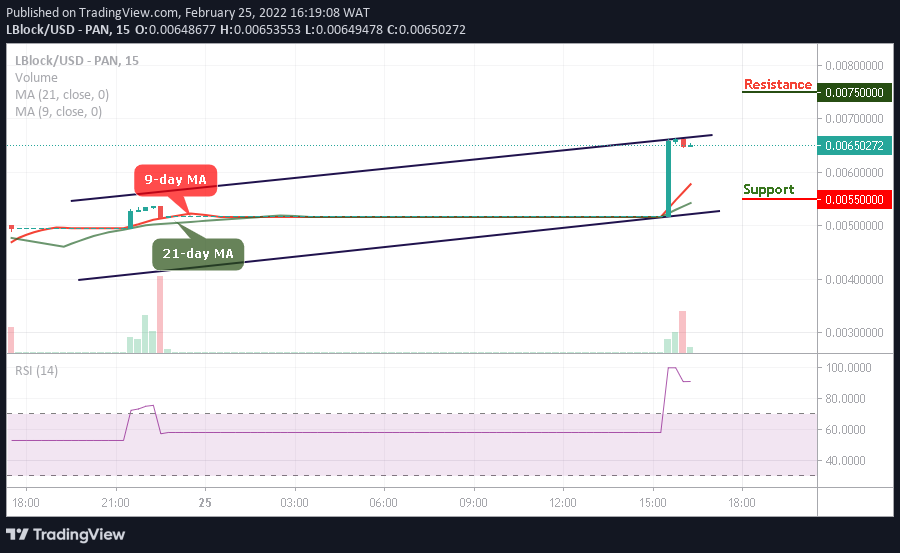
However, any bearish movement below the moving averages is likely to locate the critical support at $0.0055 and below. Now, the technical indicator Relative Strength Index (14) stays within the overbought region to confirm more bullish signals.
Read more: