Lucky Block Price Prediction: LBLOCK/USD Stays Around $0.000029 Level
Estimated Reading Time: 3 minutes
Don’t invest unless you’re prepared to lose all the money you invest. This is a high-risk investment and you are unlikely to be protected if something goes wrong. Take 2 minutes to learn more
Lucky Block Price Prediction – November 30
The Lucky Block price prediction reveals that LBLOCK keeps following the sideways movement as it fails to head toward the upside.
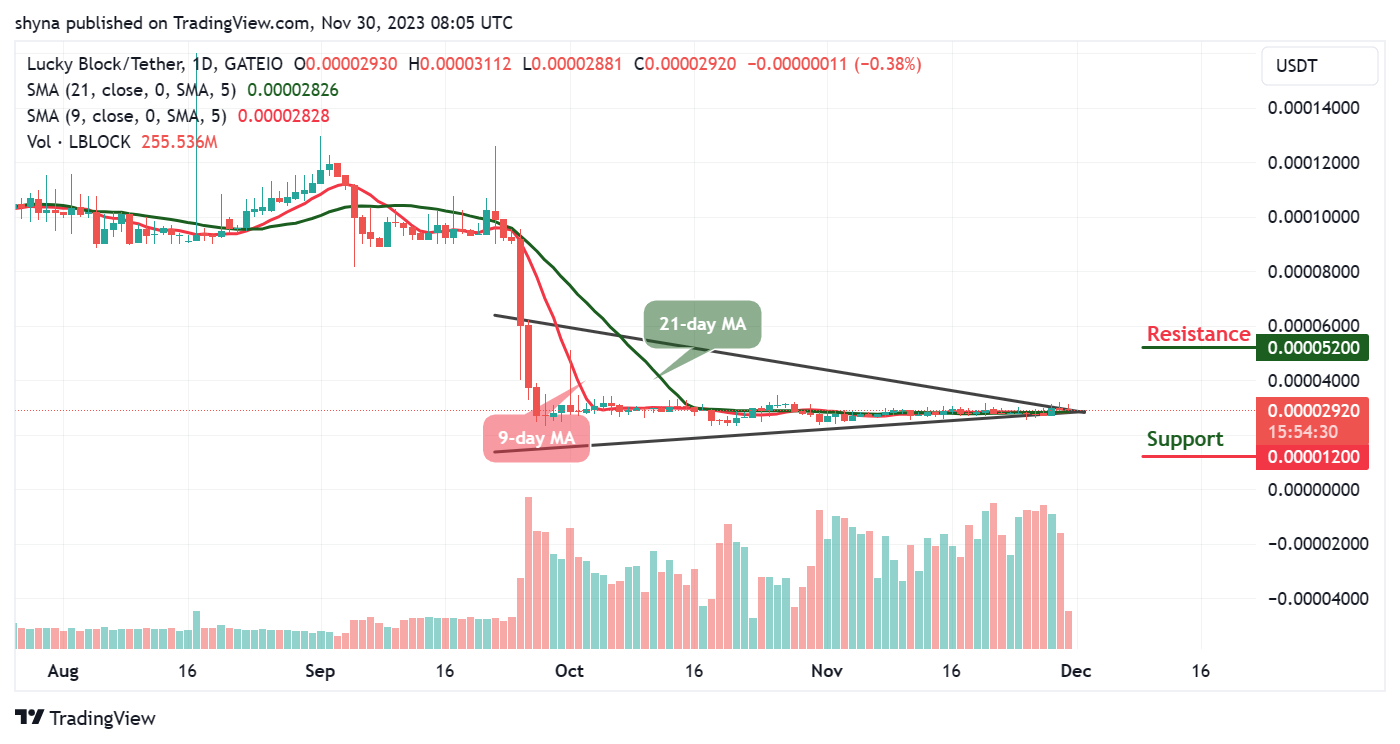
LBLOCK/USD Long-term Trend: Ranging (Daily Chart)
Key levels:
Resistance Levels: $0.000052, $0.000054, $0.000056
Support Levels: $0.000012, $0.000010, $0.000008
LBLOCK/USD is hovering at $0.000029 but the coin has not been able to reclaim the resistance level of $0.000031 hovering within the 9-day and 21-day moving averages. At the moment, the Lucky Block price may continue to follow the sideways movement, but the daily chart shows that the formation of a bullish movement would play out.
Lucky Block Price Prediction: LBLOCK Price May Consolidate to the Upside
As the Lucky Block price moves toward the east, it will remain within the 9-day and 21-day moving averages as the moving averages follow the same direction. This could mean that the Lucky Block is ready for the upside as the buyers gather momentum.
Looking at it from above, recovery may set in bit by bit as the bulls may bring LBLOCK/USD above the resistance level of $0000031. However, a sustainable movement towards the north may reach the resistance level of $0.000040, which could allow for an extended recovery in the direction of the potential resistance levels at $0.000052, $0.000054, and $0.000056. On the downside, any bearish movement may cause the Lucky Block price to hit the supports at $0.000012, $0.000010, and $0.000008.
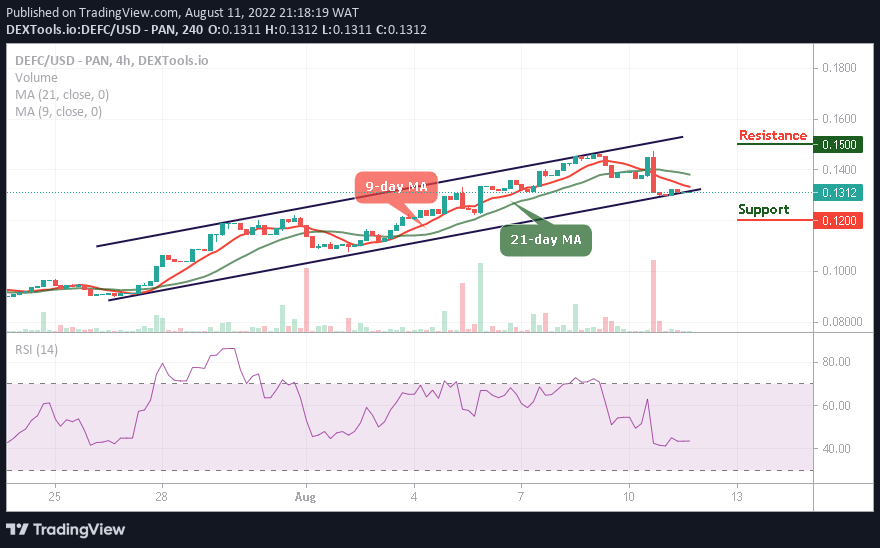
LBLOCK/USD Medium-Term Trend: Ranging (4H Chart)
Looking at the 4-hour chart, the Lucky Block price is hovering within the 9-day and 21-day moving averages. LBLOCK/USD may slide toward the lower boundary of the channel if the bearish movement increases. However, should the price cross above the 9-day moving average and head toward the upper boundary of the channel; it could locate the resistance level of $0.000032 and above.
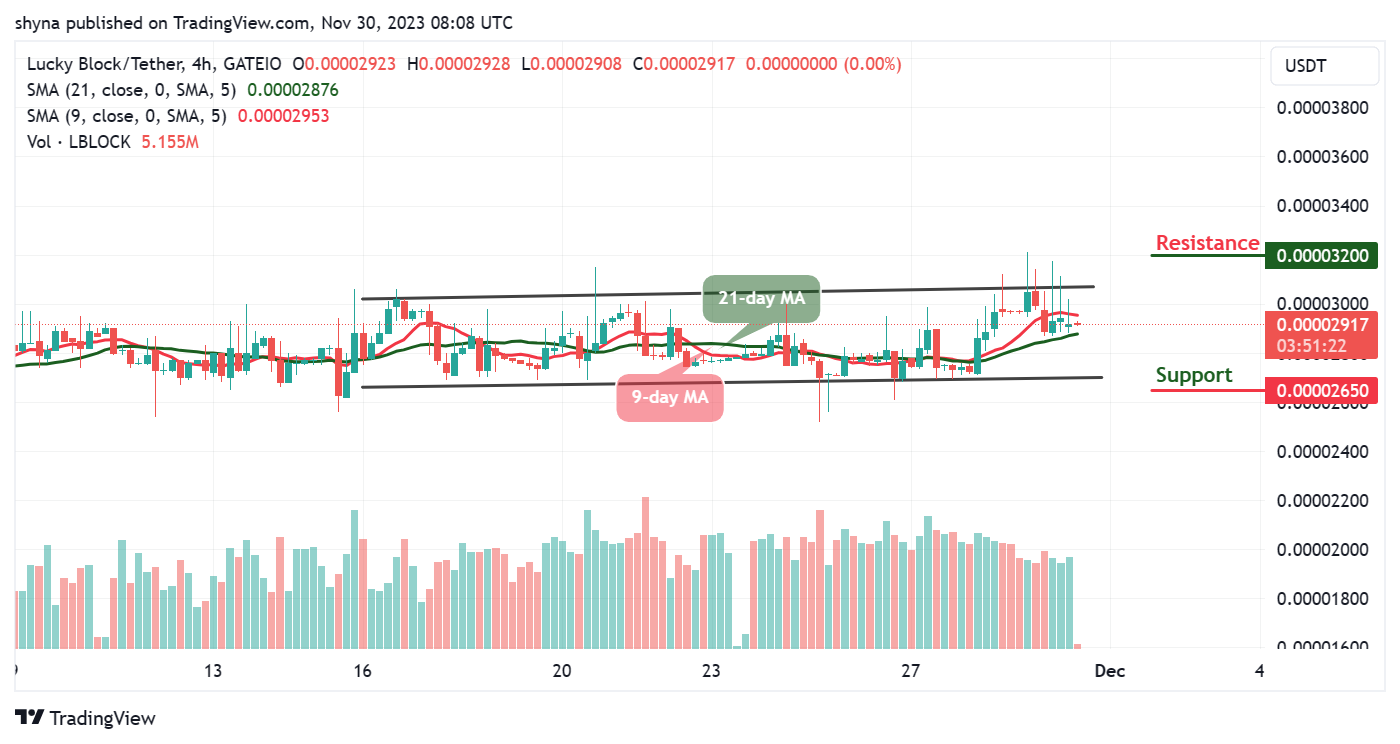
Moreover, if the bearish movement increases, the support level of $0.000027 may not be able to hold the selling pressure. Therefore, LBLOCK/USD is likely to fall to $0.000026 and below if the price crosses the lower boundary of the channel. Nevertheless, the 9-day MA remains above the 21-day MA to confirm the bullish movement, so that buyers can buy more.
You can purchase Lucky Block here. Buy LBLOCK