Lucky Block Price Forecast: LBLOCK/USD Above $0.000160 Level
Estimated Reading Time: 3 minutes
Don’t invest unless you’re prepared to lose all the money you invest. This is a high-risk investment and you are unlikely to be protected if something goes wrong. Take 2 minutes to learn more
Lucky Block Price Prediction – February 25
The Lucky Block price prediction is moving to cross above the 9-day moving average for the confirmation of the bullish movement.
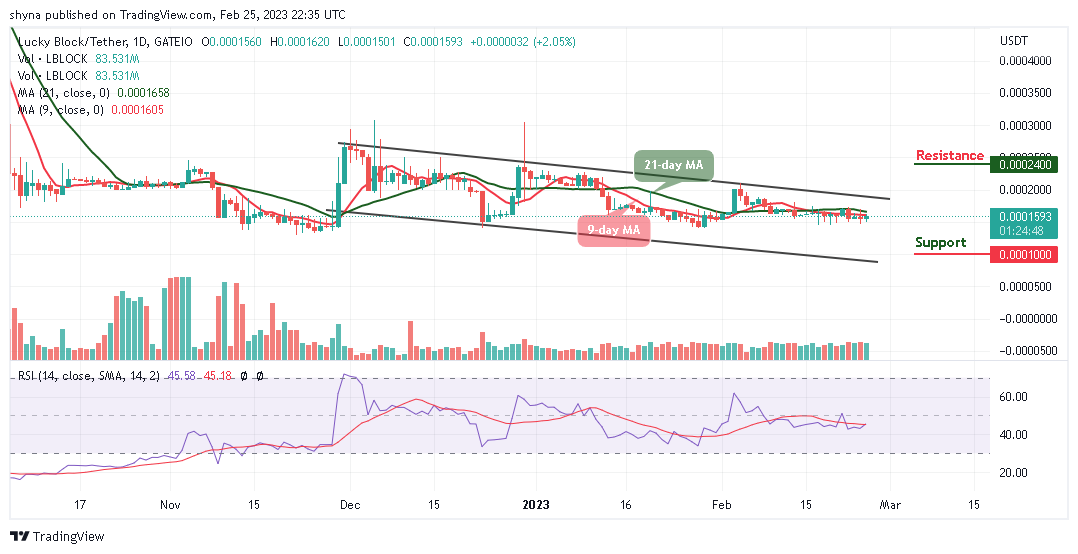
LBLOCK/USD Medium-term Trend: Bearish (1D Chart)
Key Levels:
Resistance levels: $0.000240, $0.000260, $0.000280
Support levels: $0.000100, $0.000080, $0.000060
LBLOCK/USD is ready to cross above the 9-day and 21-day moving averages to confirm the upward movement. Looking at the daily chart, the Lucky Block price is ready to create additional gains as buyers return to the market which indicates the upcoming price rally.
Lucky Block Price Prediction: LBLOCK/USD Heads to the Positive Side
The Lucky Block price is facing the north and the coin will soon climb above the moving averages, once this is done, the coin will reclaim the resistance level of $0.000200 to face the potential resistance levels of $0.000240, $0.000260, and $0.000280. Meanwhile, as the technical indicator, Relative Strength Index (14) keeps moving below the 50-level, if the bulls failed to push the coin to the north, the support levels of $0.000100, $0.000080, and $0.000060 may come to focus, which could be the best time for the new investors to come into the market.
LBLOCK/USD Medium-term Trend: Bearish (4H Chart)
The 4-hour chart reveals that the Lucky Block price crosses above the 9-day and 21-day moving averages, heading toward the upper boundary of the channel. The technical indicator Relative Strength Index (14) also crosses above the 50-level which is to confirm the presence of the buyers in the market.
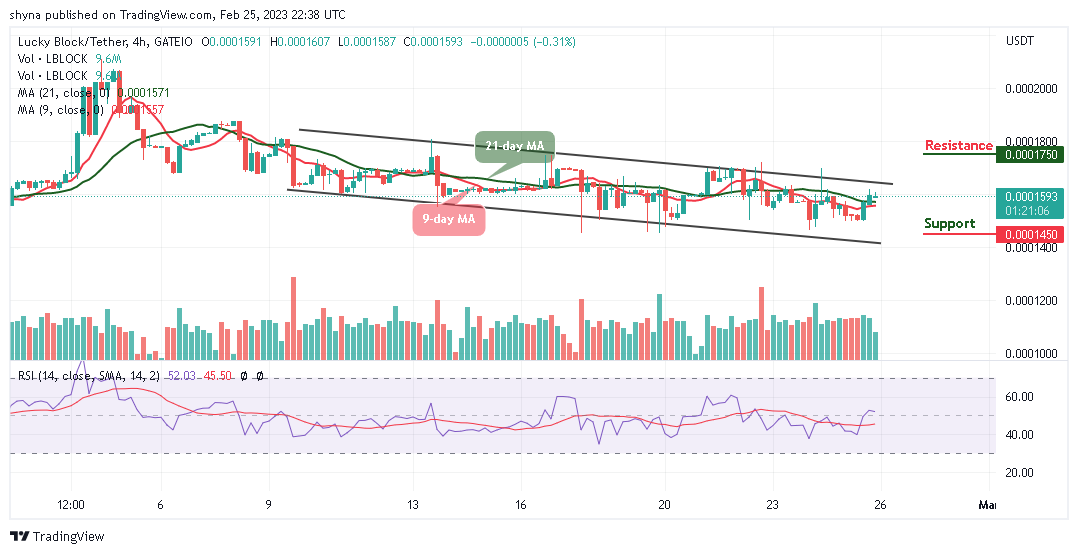
Moreover, if the bulls push the market price above the upper boundary of the channel, the Lucky Block could hit the potential resistance level of $0.000175 and above. In other words, if the coin slides and move toward the south, it could hit the nearest support at $0.000150. Therefore, any bearish movement below the lower boundary of the channel could touch the support level of $0.000145 and below.
You can purchase Lucky Block here. Buy LBLOCK