Price Forecast: Lucky Block Trades Above $0.000160 Level
Estimated Reading Time: 3 minutes
Don’t invest unless you’re prepared to lose all the money you invest. This is a high-risk investment and you are unlikely to be protected if something goes wrong. Take 2 minutes to learn more
Lucky Block Price Prediction – January 30
The Lucky Block price prediction shows that LBLOCK will cross above the moving averages to touch the nearest resistance level.
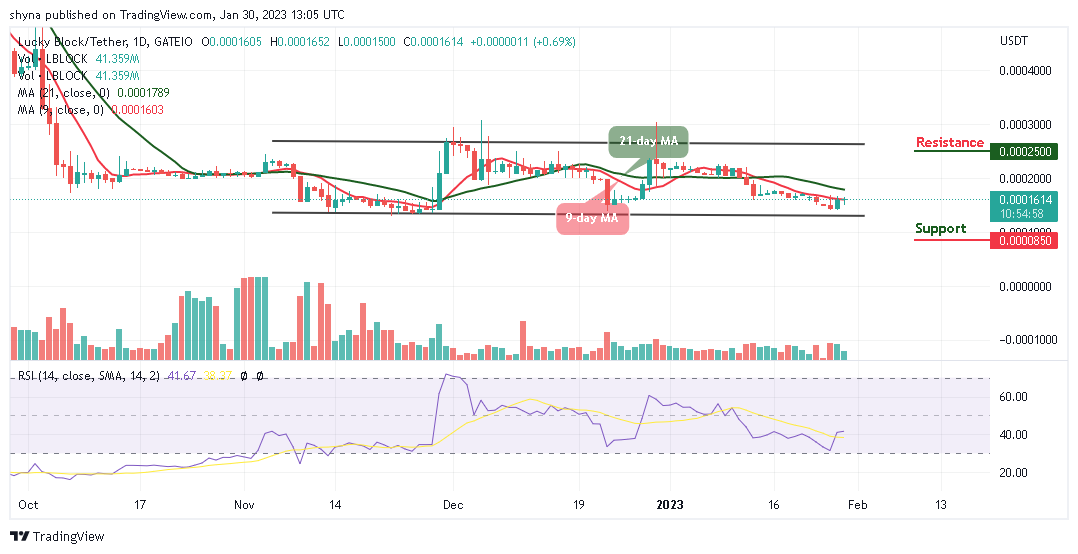
LBLOCK/USD Medium-term Trend: Ranging (1D Chart)
Key Levels:
Resistance levels: $0.000250, $0.000270, $0.000290
Support levels: $0.000085, $0.000065, $0.000045
LBLOCK/USD is at the moment following the bullish movement as the coin move to cross above the 9-day moving average. Meanwhile, the market could become cheaper if the price remains below moving averages for new buyers to invest in the coin. Moreover, should the bulls fail to push the price to the upside; the Lucky block price may retreat again before heading to the north.
Lucky Block Price Prediction: LBLOCK/USD Ready to Spike Higher
The Lucky Block price will once again break toward the upper boundary of the channel as the market price touches the resistance level of $0.000165. Therefore, any further bullish movement could push the coin to the resistance levels of $0.000250, $0.000270, and $0.000290.
Nonetheless, the upward movement could be delayed if the bears return to the market and could touch the support levels at $0.000085, $0.000065, and $0.00045. Meanwhile, the technical indicator Relative Strength Index (14) moves above the 40-level, preparing for an upward movement.
LBLOCK/USD Medium-term Trend: Bearish (4H Chart)
When compares to the 4-hour chart, the Lucky Block price remains above the 9-day and 21-day moving averages to touch the major resistance level at $0.000165. However, if the buyers push the price towards the upper boundary of the channel, higher resistance could be located at $0.000190 and above.
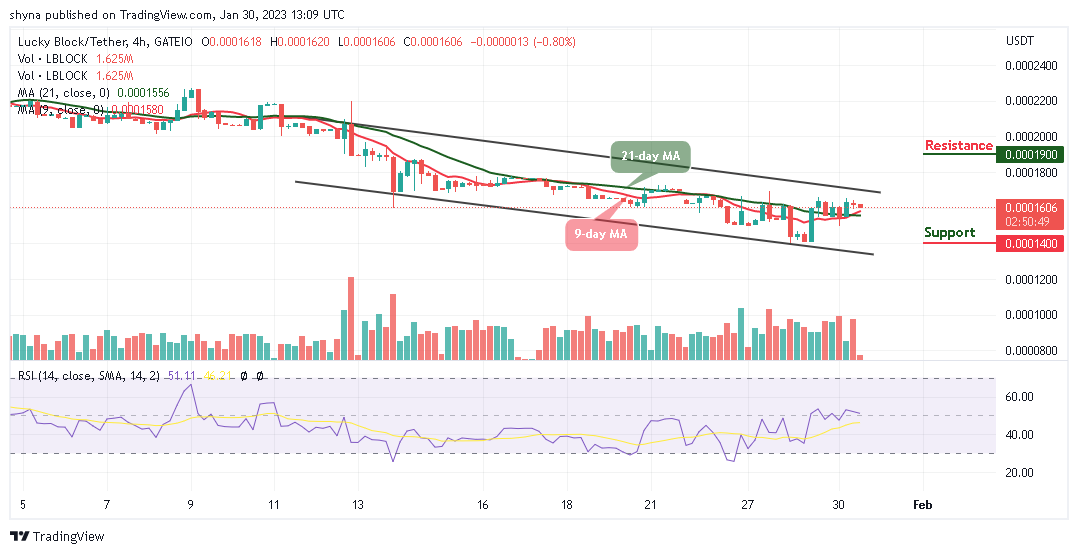
In addition, the technical indicator Relative Strength Index (14) is moving in the same direction above the 60-level, which indicates that sideways movement, may come to play. Moreover, should bulls fail to move the current market value above, the bears may step back into the market, and the nearest support level could be found at $0.000140 and below.
You can purchase Lucky Block here. Buy LBLOCK