Lucky Block Price Prediction: LBLOCK/USD Trades Around $0.000099; Time to Buy the Dip
Estimated Reading Time: 3 minutes
Don’t invest unless you’re prepared to lose all the money you invest. This is a high-risk investment and you are unlikely to be protected if something goes wrong. Take 2 minutes to learn more
Lucky Block Price Prediction – July 19
The Lucky Block price prediction keeps trading below the moving averages; the coin is waiting for new buyers to come in before moving higher.
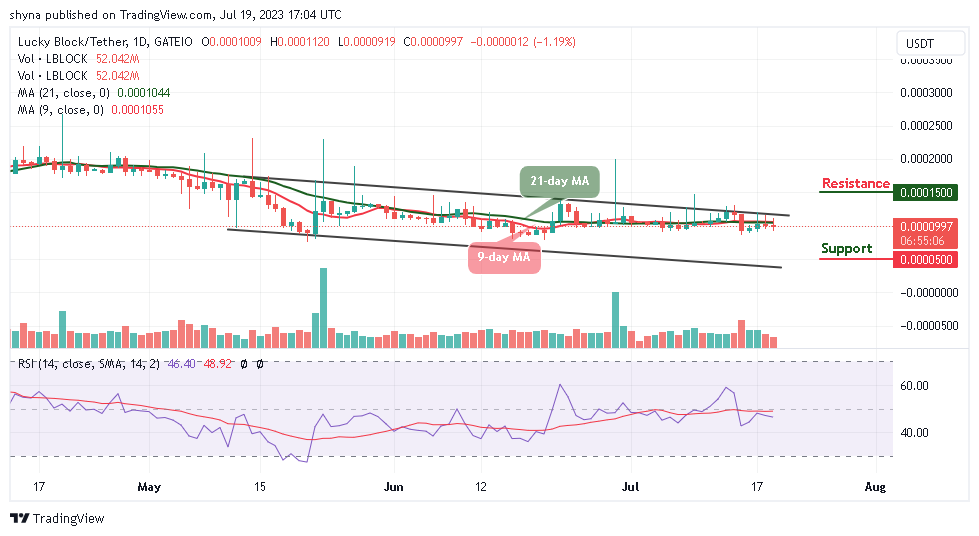
LBLOCK/USD Medium-term Trend: Ranging (1D Chart)
Key Levels:
Resistance levels: $0.000150, $0.000170, $0.000190
Support levels: $0.000050, $0.000030, $0.000010
LBLOCK/USD will soon follow a bullish movement as the coin gets ready for a spike above the 9-day and 21-day moving averages. The current movement is necessary for the coin to reach the resistance level of $000130 while new buyers are expected to enter the market. Meanwhile, if the sellers bring the market further lower, the support level of $0.000080 can be reached.
Lucky Block Price Prediction: LBLOCK Could Retreat to Move Higher
According to the daily chart, the Lucky Block price is seen below the 9-day and 21-day moving averages. If the coin retreats further, it will be a good opportunity for the existing buyers to buy the dip while the new buyers are expected to invest in the coin. The technical indicator Relative Strength Index (14) is moving in the same direction below the 50-level. Any further bearish movement may locate the supports at $0.000050, $0.000030, and $0.000010.
Nevertheless, if the buyers hold the current market value and push it to cross the upper boundary of the channel, this can make the coin hit the resistance level of $0.000140. However, any further bullish movement may locate the resistance levels of $0.000150, $0.000170, and $0.000190 respectively.
LBLOCK/USD Medium-term Trend: Ranging (4H Chart)
On the 4-hour chart, the Lucky Block (LBLOCK) ranges as the buyers are preparing to come into the market by crossing above the 9-day and 21-day moving averages. Meanwhile, if the bulls return to the market, LBLOCK/USD could trade near the resistance level of $0.000115.
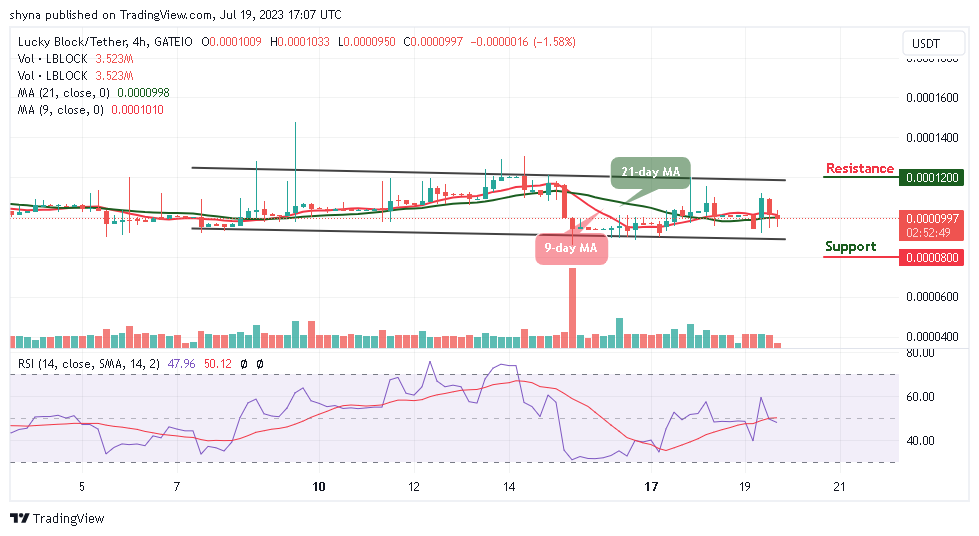
Moreover, the buyers are getting ready to push the price above the moving averages and higher resistance could be located around the upper boundary of the channel at $0.000120 and above, but any bearish movement below the lower boundary of the channel could hit the support at $0.000080 and below as the technical indicator Relative Strength Index (14) moves around the 50-level.
You can purchase Lucky Block here. Buy LBLOCK