Lucky Block Price Prediction: LBLOCK/USD Trades at $0.000029; Time to Invest
Estimated Reading Time: 3 minutes
Don’t invest unless you’re prepared to lose all the money you invest. This is a high-risk investment and you are unlikely to be protected if something goes wrong. Take 2 minutes to learn more
Lucky Block Price Prediction – April 5
The Lucky Block price prediction shows that LBLOCK digs a dip as the market price gets ready for a breakout above the moving averages.
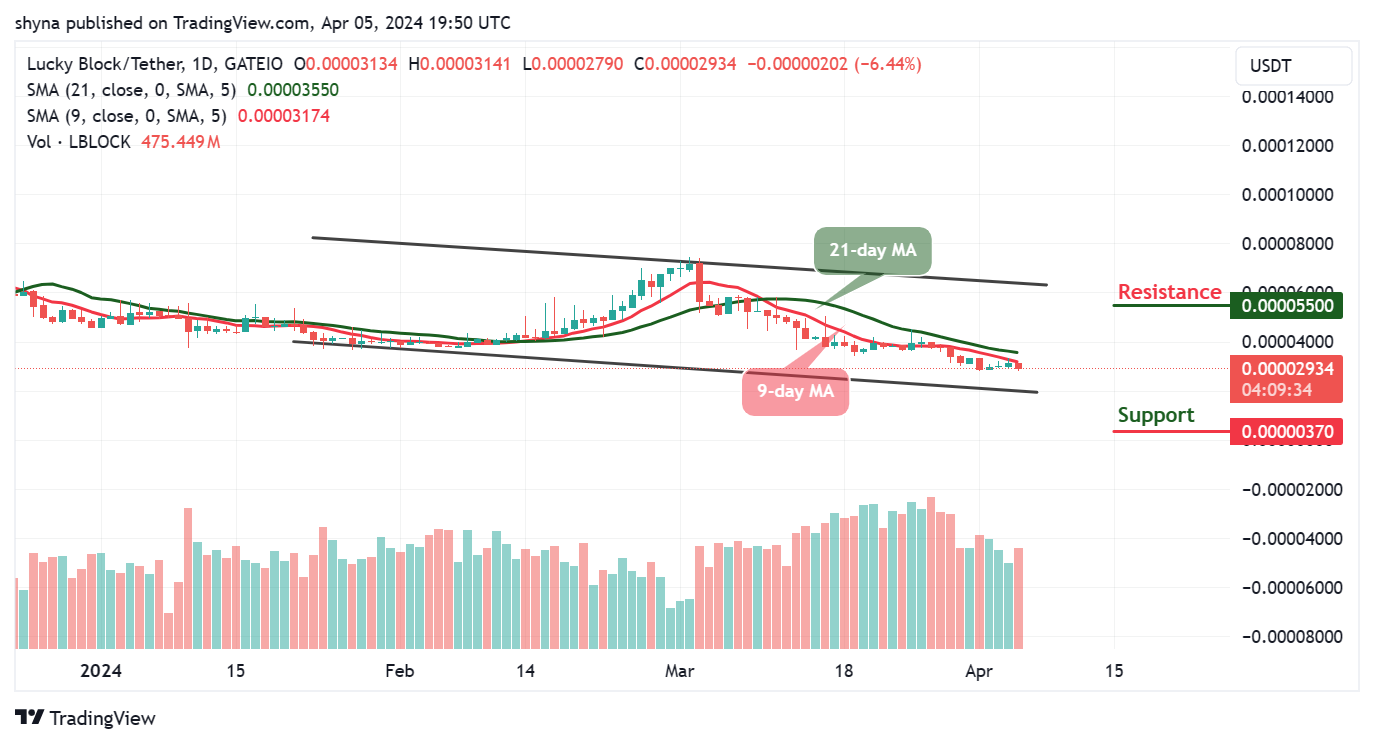
LBLOCK/USD Long-term Trend: Bearish (1D Chart)
Key Levels:
Resistance levels: $0.000055, $0.000060, $0.000065
Support levels: $0.000003, $0.000002, $0.000001
LBLOCK/USD is trading at $0.000029 as the coin prepares to cross above the 9-day and 21-day moving averages. Meanwhile, the buyers are getting ready to grab the Lucky Block (LBLOCK) and push it to the upside. Therefore, the existing buyers are expected to buy the dip as the coin prepares for upward movement.
Lucky Block Price Prediction: LBLOCK Will Break to the Upside
The Lucky Block price will retrace to the upside, buyers and new investors are expected to look out for the next bearish signals. The coin may fall slightly if the 9-day moving average heads to the south, but the coin would spike to the upside as soon as it crosses above the 21-day moving average. Meanwhile, any bearish slide below the lower boundary of the channel can locate supports at $0.000003, $0.000002, and $0.000001.
However, if buyers manage to drive the coin above the moving averages, immediate resistance is anticipated at $0.000040. Furthermore, a sustained bullish momentum could potentially encounter resistance levels at $0.000055, $0.000060, and $0.000065. It’s crucial for new buyers to closely monitor these levels as they navigate the market. Additionally, a break above these resistances could signal a significant bullish trend, potentially opening up new opportunities for traders.
LBLOCK/USD Medium-term Trend: Ranging (4H Chart)
According to the 4-hour chart, the Lucky Block price keeps hovering below the 9-day and 21-day moving averages. The buyers are expected to re-invest in the coin while the new buyers should into the market.
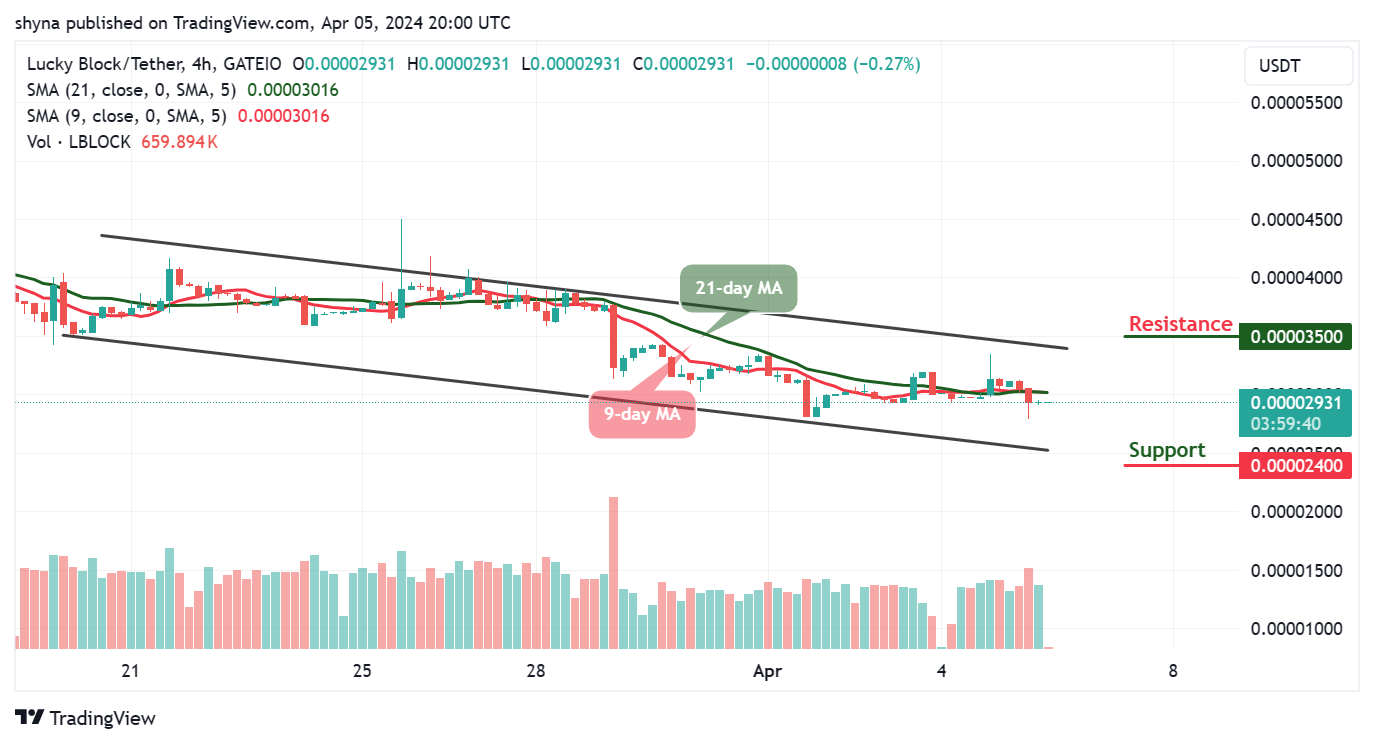
From above, if the buyers push the price above the moving averages, any further bullish movement toward the upper boundary of the channel will locate the resistance level at $0.000035 and above. In the meantime, should the coin create an additional low, the nearest support can come at $0.000024 and below.
You can purchase Lucky Block here. Buy LBLOCK