Lucky Block Price Prediction: LBLOCK/USD Trades Near $0.0020 Level
Estimated Reading Time: 3 minutes
Don’t invest unless you’re prepared to lose all the money you invest. This is a high-risk investment and you are unlikely to be protected if something goes wrong. Take 2 minutes to learn more

Free Crypto Signals Channel
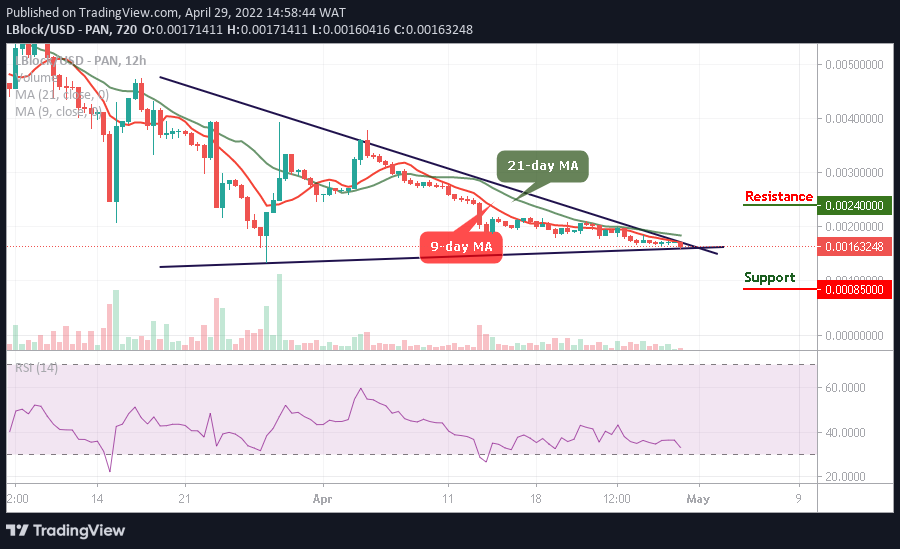
The 12-hour chart reveals that the Lucky Block price prediction is getting ready for a cross above the upper boundary of the channel.
LBLOCK/USD Medium-term Trend: Bearish (12H Chart)
Key Levels:
Resistance levels: $0.0024, $0.0026, $0.0028
Support levels: $0.0008, $0.0006, $0.0004
At the time of writing, LBLOCK/USD is trading below the 9-day and 21-day moving averages. Meanwhile, as the coin moves within the channel, the bullish momentum would push the coin towards the resistance level of $0.0020. However, should the bulls fail to push the price upward; the Lucky block price will retreat below the lower boundary of the channel to allow more buyers to come into the market.
Lucky Block Price Prediction: LBLOCK/USD Prepares for the Upside Movement
The Lucky Block price is hovering at $0.0016 as it prepares to cross above the upper boundary of the channel. However, if the coin spikes to the north, it would locate the potential resistance levels at $0.0024, $0.0026, and $0.0028 but any bearish movement below the lower boundary of the channel could hit the support levels at $0.0008, $0.0006, and $0.0004 respectively. Meanwhile, the technical indicator Relative Strength Index (14) moves below the 30-level, which could increase the bearish momentum.
LBLOCK/USD Medium-term Trend: Bearish (4H Chart)
On the 4-hour chart, LBLOCK/USD crosses below the 9-day and 21-day moving averages as the technical indicator Relative Strength Index (14) moves into the overbought region to push the coin to the upside. Moreover, any bullish movement above the current market value at $0.0016 could hit the potential resistance level at $0.0018 and above.
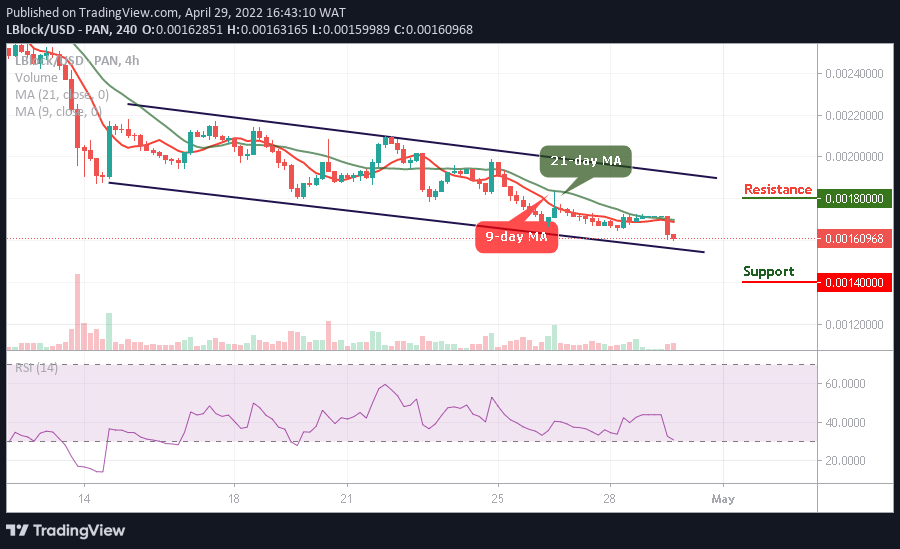
Nevertheless, to allow more investors to come into the market, LBLOCK/USD may retreat below the channel, once this comes to focus; it could touch the critical support at $0.0014 and below as the existing buyers are expected to buy the dip.
Read more: