Lucky Block Price Prediction: LBLOCK/USD Trades Near $0.0040 Resistance
Estimated Reading Time: 2 minutes
Don’t invest unless you’re prepared to lose all the money you invest. This is a high-risk investment and you are unlikely to be protected if something goes wrong. Take 2 minutes to learn more

Free Crypto Signals Channel
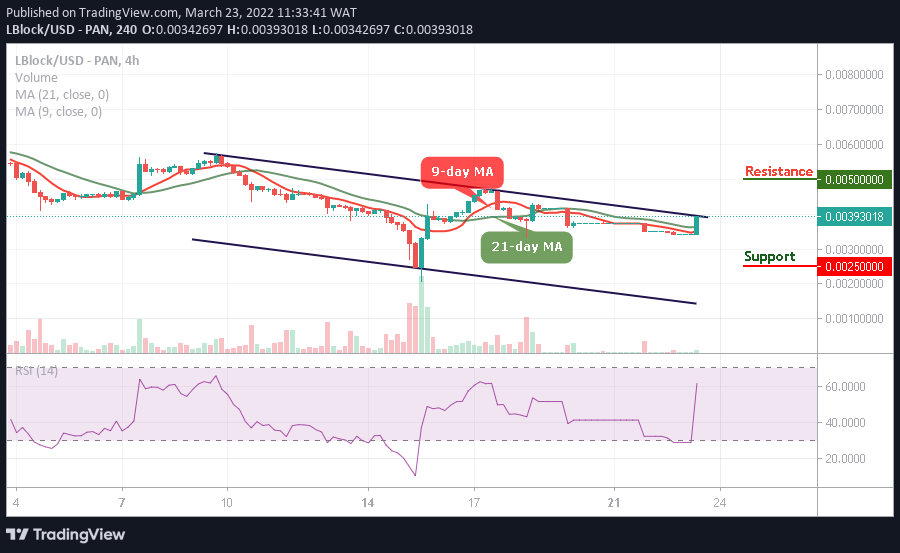
The 4-hour chart reveals that the Lucky Block price prediction gets ready for a cross above the upper boundary of the channel.
LBLOCK/USD Medium-term Trend: Ranging (4H Chart)
Key Levels:
Resistance levels: $0.0050, $0.0055, $0.0060
Support levels: $0.0025, $0.0020, $0.0015
At the time of writing, LBLOCK/USD is trading above the 9-day and 21-day moving averages. Meanwhile, the bullish momentum would push the coin towards the resistance level of $0.0050, and should the bulls fail to push the price upward, the Lucky block price may retreat within the channel.
Lucky Block Price Prediction: LBLOCK/USD Would Break to the Upside
The Lucky Block price is hovering at $0.0039 where it prepares to cross above the upper boundary of the channel. However, if the coin spikes to the north, it would locate the potential resistance levels at $0.0050, $0.0055, and $0.0060 but any bearish movement towards the lower boundary of the channel could hit the support levels at $0.0025, $0.0020, and $0.0015 respectively. Meanwhile, the technical indicator Relative Strength Index (14) moves above 60-level to confirm the bullish movement.
LBLOCK/USD Medium-term Trend: Ranging (2H Chart)
On the 2-hour chart, LBLOCK/USD stays above the 9-day and 21-day moving averages as the technical indicator Relative Strength Index (14) moves into the overbought region to push the coin to the upside. Moreover, any further bullish movement above the current market value at $0.0039 could hit the potential resistance level at $0.0050 and above.
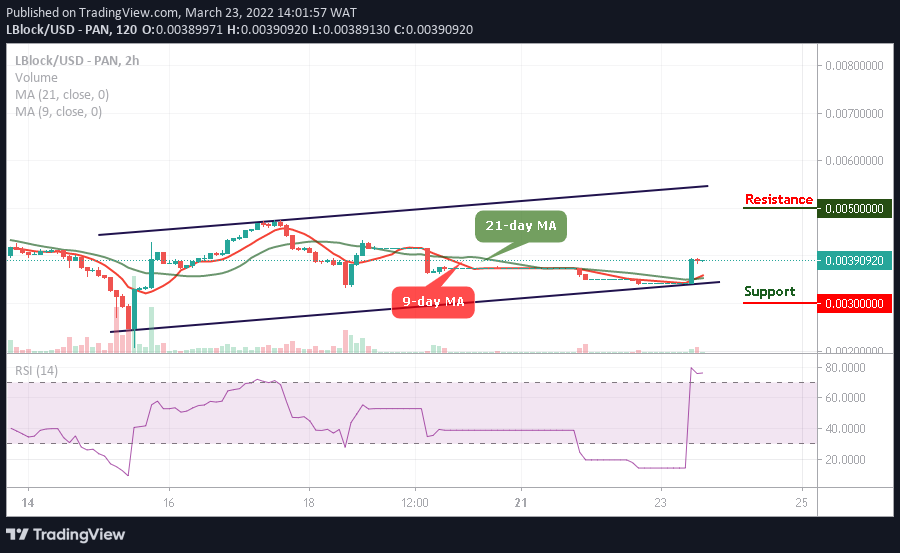
On the contrary, LBLOCK/USD may retreat below the moving averages, so once this comes to focus, it could touch the critical support at $0.0030 and below as the new buyers are expected to come into the market.
Read more: