Lucky Block Price Prediction: LBLOCK/USD Will Attempt an Upside Retracement; Price Hovers Around $0.000160
Estimated Reading Time: 3 minutes
Don’t invest unless you’re prepared to lose all the money you invest. This is a high-risk investment and you are unlikely to be protected if something goes wrong. Take 2 minutes to learn more
Lucky Block Price Prediction – March 23
The Lucky Block price will recover to the upside as the coin stays above the 9-day and 21-day moving averages.
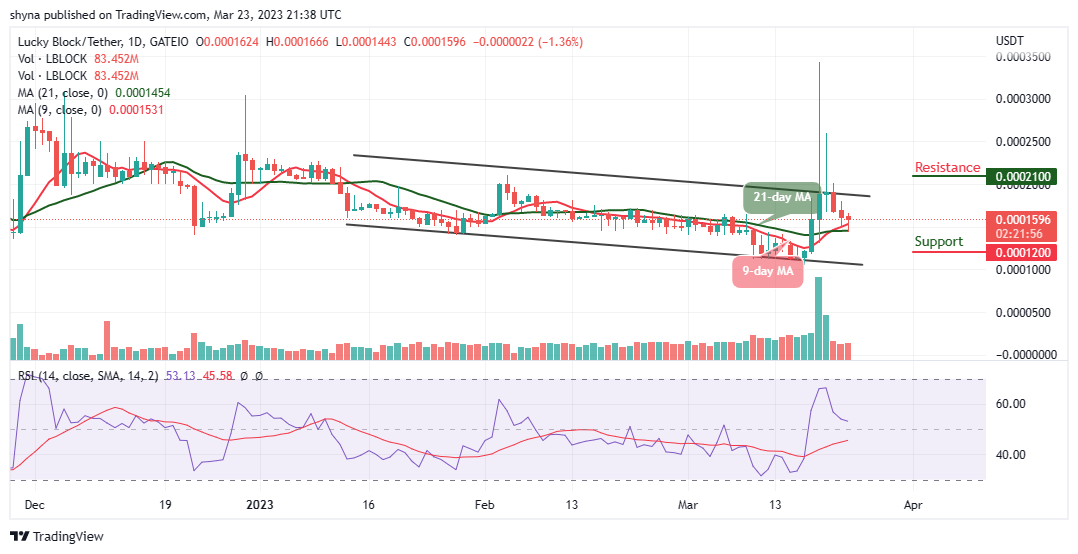
LBLOCK/USD Medium-term Trend: Ranging (1D Chart)
Key Levels:
Resistance levels: $0.000210, $0.000220, $0.000230
Support levels: $0.000120, $0.000110, $0.000100
LBLOCK/USD is ranging as the market price stays above the 9-day and the 21-day moving averages, this could be necessary so that the coin can retrace the lost resistance. However, the market price can retreat a little by crossing below the moving averages so that buyers could buy the dips. Meanwhile, if the bulls delay the bullish movement, the Lucky block price may create an additional low.
Lucky Block Price Prediction: LBLOCK/USD Will Spike Higher
According to the daily chart, the 9-day MA is crossing above the 21-day MA, this is to confirm that the Lucky Block price will begin to break higher which could hit the nearest resistance level of $0.000200. However, any further bullish movement will locate the potential resistance levels at $0.000210, $0.000220, and $0.000230.
Nevertheless, if the upward movement is been delayed, the sellers can bring the market price below the moving averages and this could touch the support levels at $0.000120, $0.000110, and $0.000100. The technical indicator Relative Strength Index (14) is still hovering above the 50-level, getting the coin ready for the upward movement.
LBLOCK/USD Medium-term Trend: Ranging (4H Chart)
When compares to the 4-hour chart, the Lucky Block price keeps moving sideways below the 9-day and 21-day moving averages, as buyers move to push the coin to the upside. Moreover, once this comes into focus, a higher resistance level could be located at $0.000250 and above.
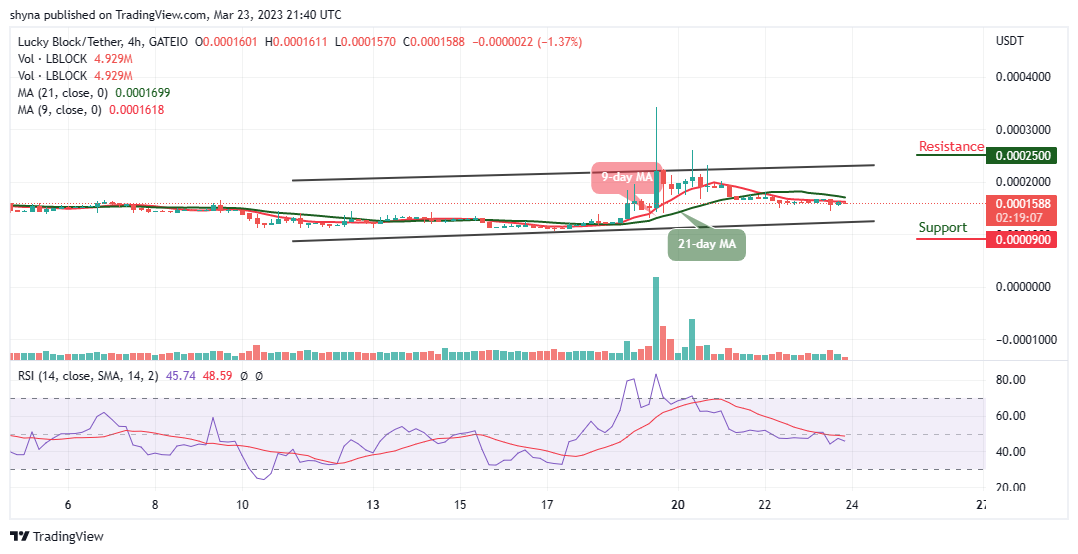
On the other hand, the technical indicator Relative Strength Index (14) will cross above the 50-level if the bulls increase the buying pressure. Therefore, should bulls fail to increase the current market value above, the bears could step back into the market, and the nearest support level could be found at $0.000090 and below.
You can purchase Lucky Block here. Buy LBLOCK