Lucky Block Price Prediction: LBLOCK/USD Will Reclaim $0.0025 Resistance
Estimated Reading Time: 2 minutes
Don’t invest unless you’re prepared to lose all the money you invest. This is a high-risk investment and you are unlikely to be protected if something goes wrong. Take 2 minutes to learn more

Free Crypto Signals Channel
The Lucky Block price prediction will soon spike above the moving averages as the coin heads to the upside.
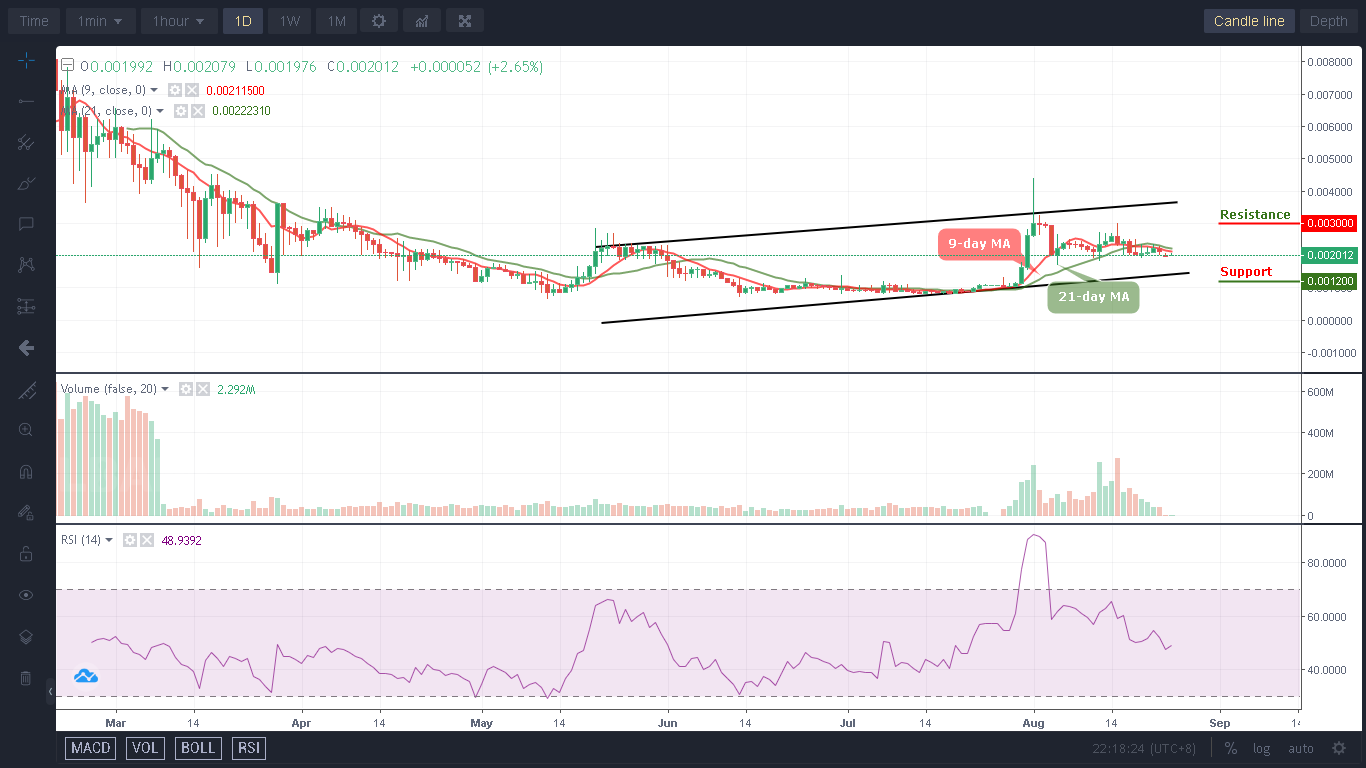
LBLOCK/USD Medium-term Trend: Ranging (1D Chart)
Key Levels:
Resistance levels: $0.0030, $0.0032, $0.0034
Support levels: $0.0012, $0.0010, $0.0009
LBLOCK/USD is therefore getting ready to cross above the 9-day and 21-day moving averages before heading towards the upper boundary of the channel. However, traders are anticipating that the current price movement will be an indication that the bullish movement is coming to focus.
Lucky Block Price Prediction: LBLOCK/USD Will Consolidate Before Shooting to the Upside
According to the daily chart, the Lucky Block price is ready to reclaim the resistance level of $0.0025 as the coin is ready to spike above the 9-day and 21-day moving averages; once this is done, bulls would now face resistance levels of $0.0030, $0.0032, and $0.0034 respectively. As the technical indicator Relative Strength Index (14) faces the 50-level, if the coin retreats a little bit to the south, the support levels of $0.0012, $0.0010, and $0.0008 may be visited and this would be the best opportunity for the new investors to come into the market.
LBLOCK/USD Medium-term Trend: Ranging (4H Chart)
On the 4-hour chart, the Lucky Block price is sliding below the 9-day and 21-day moving averages; it is likely to head towards the lower boundary of the channel as new buyers are expected to come into the market. The technical indicator Relative Strength Index (14) could head cross above the 50-level if it maintains its current position.
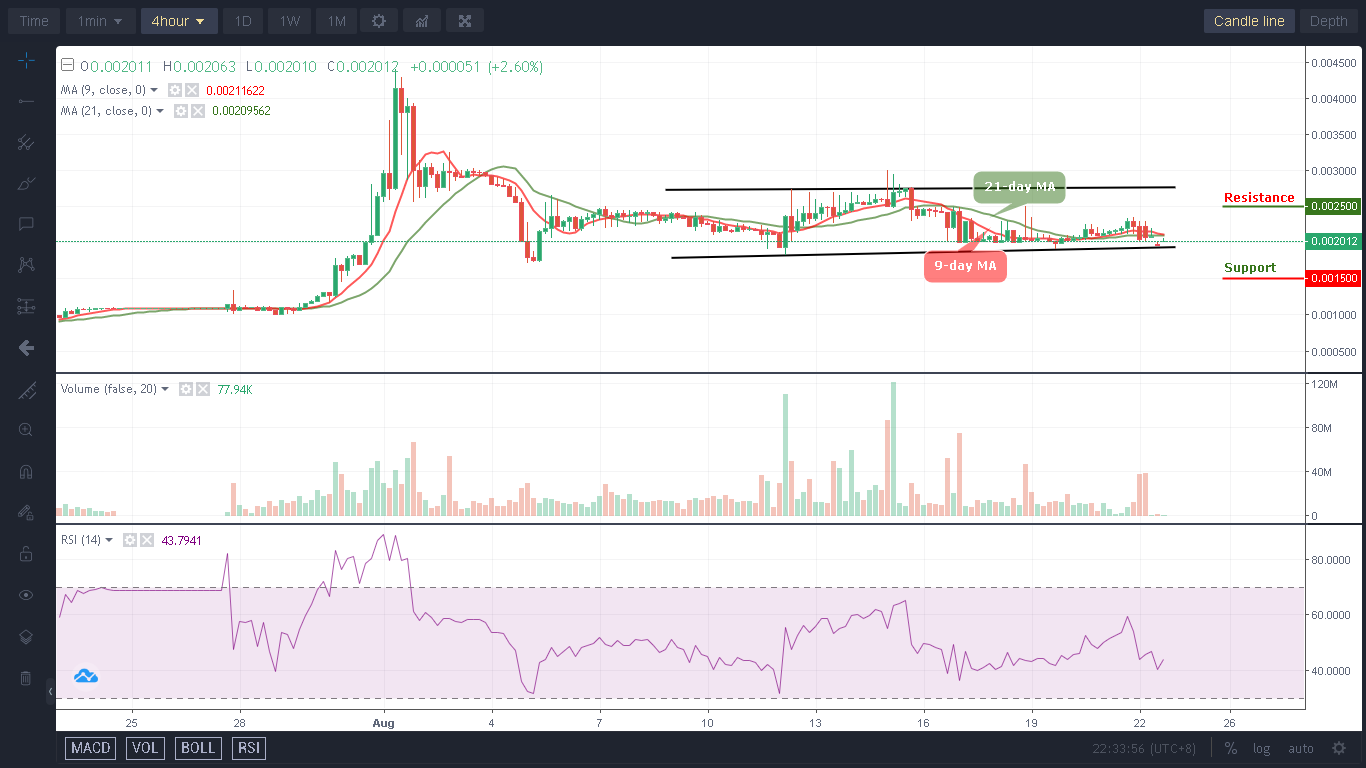
Moreover, if the bulls push the price above the 9-day and 21-day moving averages, the Lucky Block will rise to the resistance level of $0.0025 and above. Moreover, any movement below the lower boundary of the channel can bring the coin to the support level of $0.0015 and below.
You can purchase Lucky Block here. Buy LBLOCK