Lucky Block Price Prediction: LBLOCK/USD Will Retracement Above $0.000100
Estimated Reading Time: 3 minutes
Don’t invest unless you’re prepared to lose all the money you invest. This is a high-risk investment and you are unlikely to be protected if something goes wrong. Take 2 minutes to learn more
Lucky Block Price Prediction – August 8
The Lucky Block price rebounds from the early dip at $0.000094 as the buying interest may increase on approach to $0.000100.
LBLOCK/USD Long-term Trend: Ranging (1D Chart)
Key levels:
Resistance Levels: $0.000140, $0.000150, $0.000160
Support Levels: $0.000060, $0.000050, $0.000040
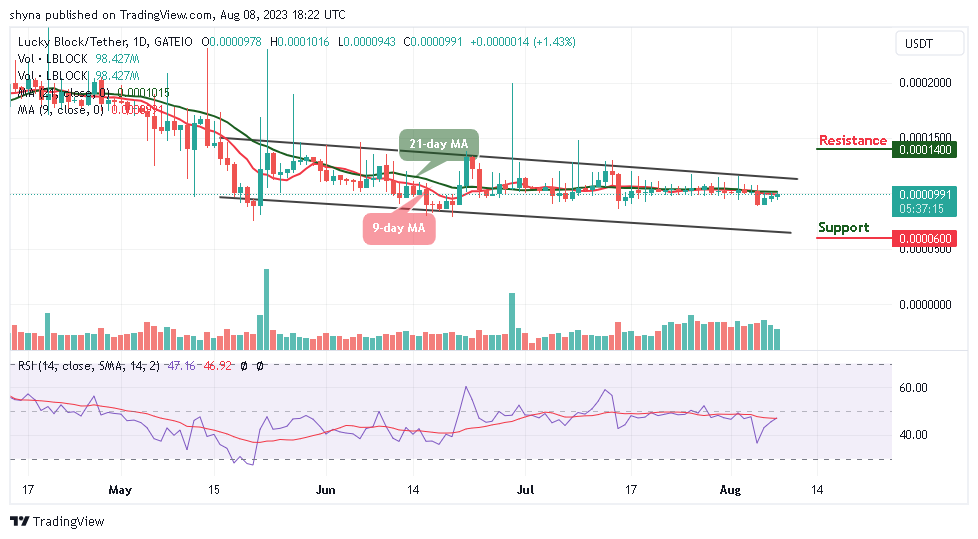
LBLOCK/USD is ranging as the market establishes a cross above $0.000100 but currently rebounding to retain the previous resistance at $0.000099. The buyers may begin to look for some resistance levels if the coin crosses above the 9-day and 21-day moving averages.
Lucky Block Price Prediction: LBLOCK Price May Reclaim $0.000100 Resistance
In the past few hours, after the Lucky Block price touches the daily low of $0.000099, the coin could now face the resistance level of $0.00110 and looking forward to the resistance level of $0.000120. However, the daily chart reveals that if the 9-day moving average crosses above the 21-day moving average, it will confirm the next direction of the coin.
At the time of writing, the technical indicator Relative Strength Index (14) may cross above the 40-level to indicate a bullish movement. Therefore, if the Lucky Block price breaks above the 9-day and 21-day moving averages, it could hit the resistance levels of $0.000140, $0.000150, and $0.000160, but any bearish movement below the lower boundary of the channel could hit the supports at $0.000060, $0.000050, and $0.000040.
LBLOCK/USD Medium-Term Trend: Ranging (4H Chart)
According to the 4-hour chart, the Lucky Block price is seen moving sideways within the 9-day and 21-day moving averages as the technical indicator Relative Strength Index moves above the 50-level. From above, if the Lucky Block price heads toward the upper boundary of the channel, the bullish influence could spike, and the accrued gains above the channel.
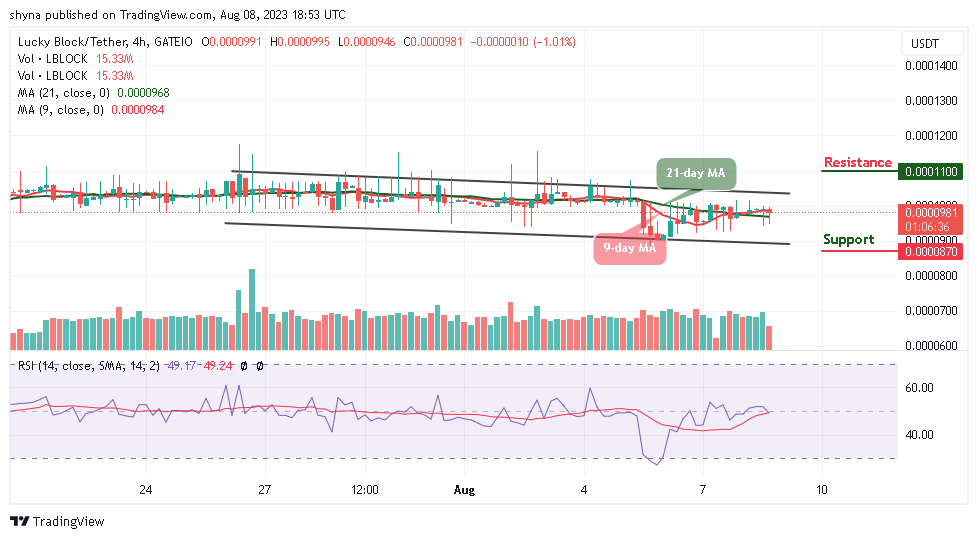
However, the current candle could fail to cross above the moving averages, and the ultimate target remains at $0.000087 and below but the best the bulls can do is to hold above the resistance level of $0.000100 and keep their attention on breaking the potential resistance at $0.000110 and above.
You can purchase Lucky Block here. Buy LBLOCK