Polkadot (DOT) Consolidates Above $40 Support, Uptrend Likely
Estimated Reading Time: 2 minutes
Don’t invest unless you’re prepared to lose all the money you invest. This is a high-risk investment and you are unlikely to be protected if something goes wrong. Take 2 minutes to learn more
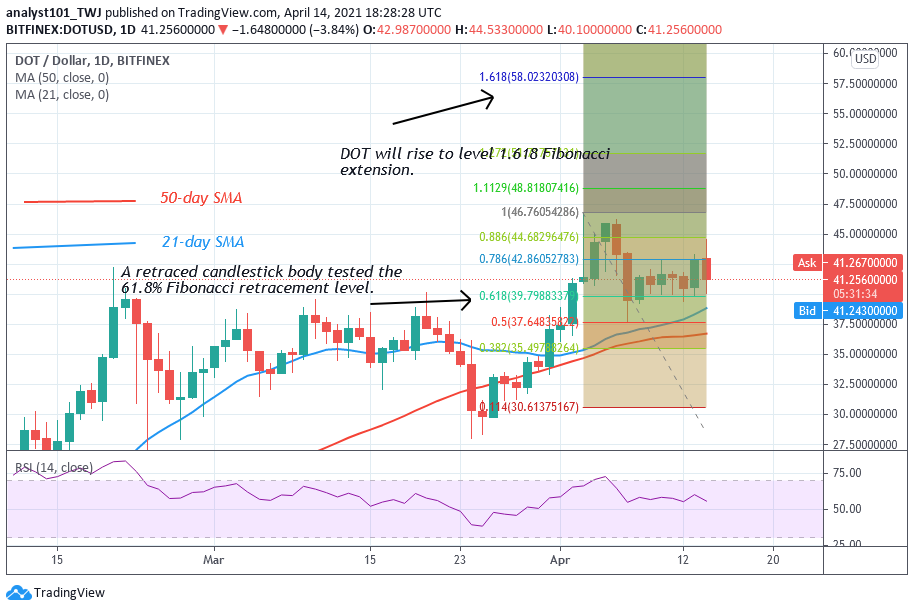
Polkadot (DOT) Long-Term Analysis: Bullish
Polkadot’s price has rallied to the high of $44.50. After attaining a new high, the altcoin at the recent high. The rejection causes the altcoin to decline to a $37.50 low. For the past week, the DOT price has been consolidating above the current support. Meanwhile, on April 3 uptrend; a retraced candlestick body tested the 61.8% Fibonacci retracement level. The retracement implies that DOT will rise to level 1.618 Fibonacci extension or $58.02.
Polkadot (DOT) Indicator Analysis
The crypto is at level 55 of the Relative Strength Index period 14. It indicates that the market is in the uptrend zone and above the centerline 50. DOT price has enough room to rally on the upside. The market will continue to rise as long as price is above the SMAs.
Technical indicators:
Major Resistance Levels – $48, $52, $56
Major Support Levels – $32, $28, $24
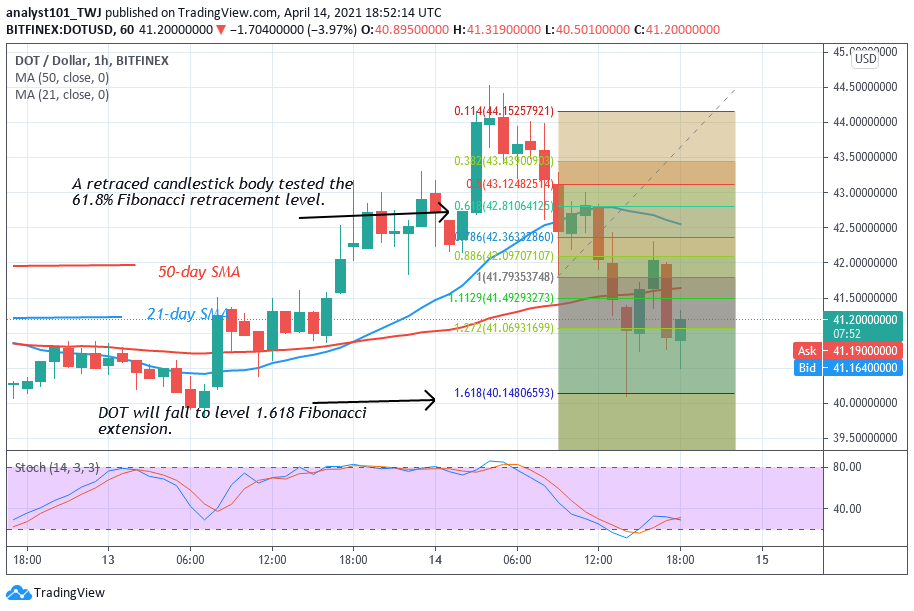
What Is the Next Direction for Polkadot (DOT)?
The altcoin has been in a downward move. The downtrend has extended to the low of $40. Today, the candlestick is showing protruding tails, pointing to the $40 support. The long tails indicate that the market has strong buying pressure above the current support at $40. On April 14 downtrend, a retraced candle body tested the 61.8% Fibonacci retracement level. This retracement implies that DOT will fall to level 1.618 Fibonacci extensions or the low of $40.14.
Note: cryptosignals.org is not a financial advisor. Do your research before investing your funds in any financial asset or presented product or event. We are not responsible for your investing results