Polkadot (DOT) Resumes Upward After a Minor Retracement From $46 High
Estimated Reading Time: 2 minutes
Don’t invest unless you’re prepared to lose all the money you invest. This is a high-risk investment and you are unlikely to be protected if something goes wrong. Take 2 minutes to learn more
Polkadot (DOT) Long-Term Analysis: Bullish
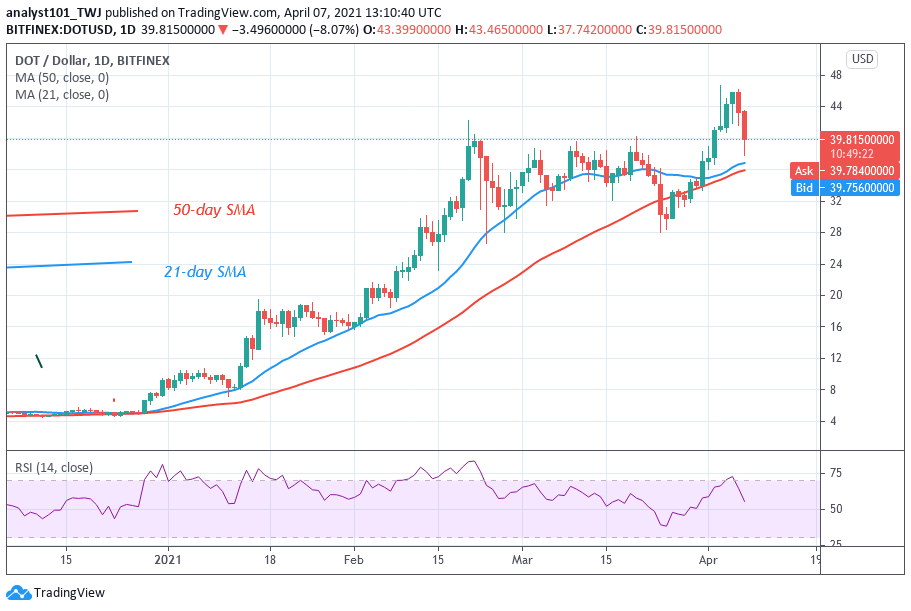
Presently, the altcoin is retracing from the recent high. Before now, DOT price was in an uptrend when it reached a high of $45.86. The altcoin was resisted because the market has reached the overbought region. DOT price has fallen and found support above $38 low. This current support is the previous resistance level in February when the uptrend was repelled
Polkadot (DOT) Indicator Analysis
The crypto is at level 54 of the Relative Strength Index period 14. It indicates that the market is in the uptrend zone and above the centerline 50. The crypto’s price is above the moving averages which indicates that the upward move is likely.
Technical indicators:
Major Resistance Levels – $48, $52, $56
Major Support Levels – $32, $28, $24
What Is the Next Direction for Polkadot (DOT)?
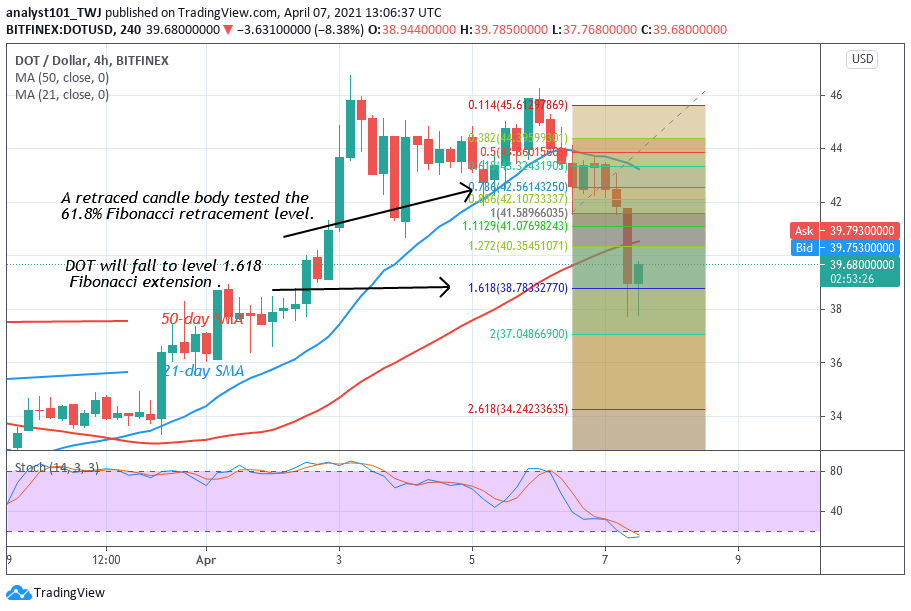
Polkadot is likely to resume upward as price retraces and found support above $38. On the downtrend of April 6, a retraced candle body tested the 61.8% Fibonacci retracement level. This retracement implies that DOT will fall to level 1.618 Fibonacci extensions or the low of $38.78. DOT price is fluctuating above the 1.618 Fibonacci extension.
Note: cryptosignals.org is not a financial advisor. Do your research before investing your funds in any financial asset or presented product or event. We are not responsible for your investing results