Polygon (MATIC/USD) Market Keeps a Low-Bearish Trend
Estimated Reading Time: 3 minutes
Don’t invest unless you’re prepared to lose all the money you invest. This is a high-risk investment and you are unlikely to be protected if something goes wrong. Take 2 minutes to learn more
Polygon Price Prediction – April 9
The MATIC/USD market keeps a low-bearish trend toward the support of the $1 trading line. Over time, selling pressures have been between $1.111 and $1.090 value points with a negative percentage rate of 1.00. If the devaluation-moving course eventually breaks lower beyond the $1.10 zone, the weakly-pushing pace will likely prolong in the subsequent operations.
MATIC/USD Market
Key Levels
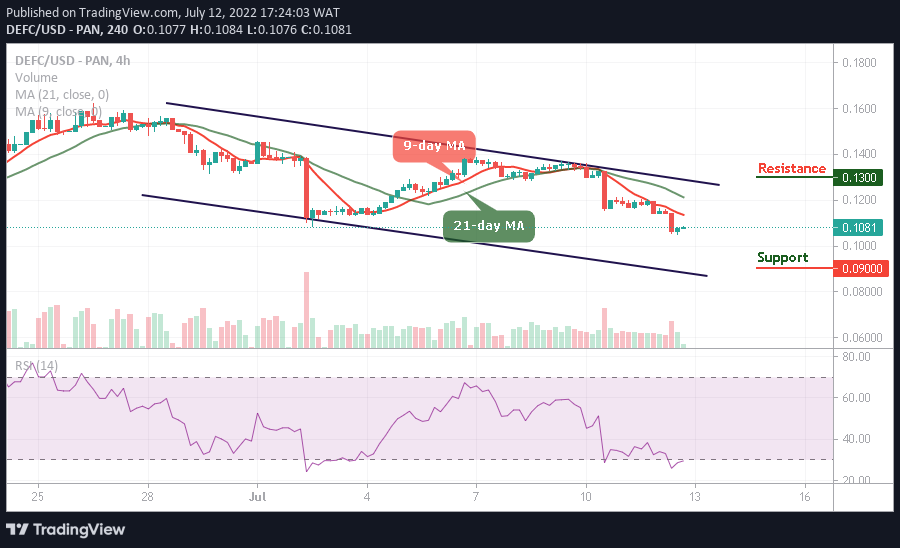
Resistance levels: $1.20, $1.30, $1.40
Support levels: $1, $0.90, $0.80
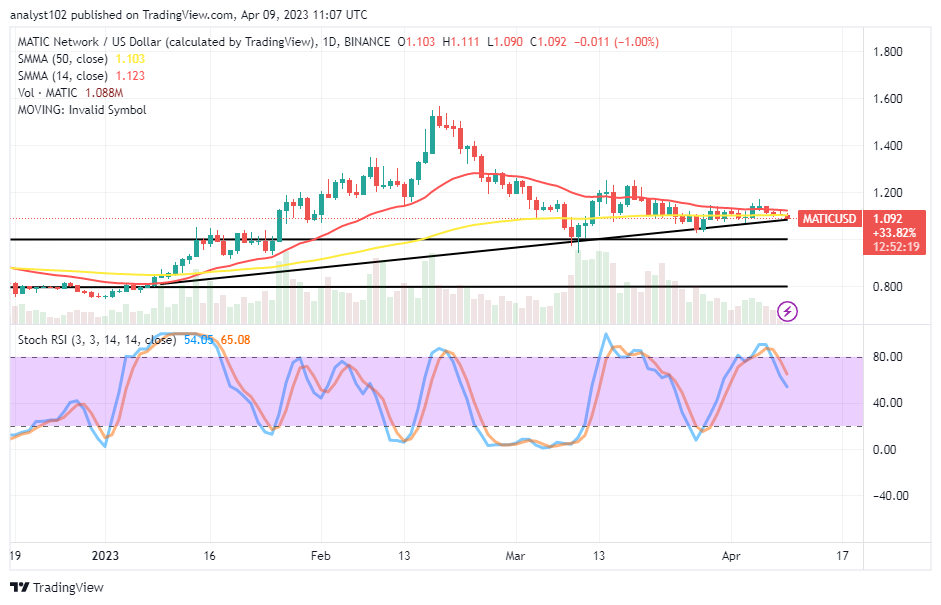
MATIC/USD – Daily Chart
The MATIC/USD daily chart reveals the crypto-economic market keeps a low-bearish trend slightly across the SMAs’ paths. The 14-day SMA indicator is at $1.123 above the $1.103 value line of the 50-day SMA indicator. A smaller bearish trading candlestick is in the making against the bullish trend line drawn to ascertain the critical spot that the price will need to go southward further to establish the signs of seeing more lows in the following sessions. The Stochastic Oscillators have crossed southbound from the overbought region to 65.08 and 54.05 levels.
Is it technically ideal to trade now alongside the current fall move in MATIC/USD market operations?
Although there is a predominance of a falling force in the MATIC/USD trade, it is not ethical enough to go along its side as the crypto-economic market keeps a low-bearish trend. The current rate of diminishing force has not allowed for a breach of the defined bullish trend line. As a result, buying may suspend until a reliable candlestick-based signal forms to rule out the possibility of further lows below the indications.
On the downside of the technical analysis, there has not yet been a clear-cut change of direction to truncate the decline in the MATIC/USD price. Implementation of an immediate shorting order position is now not as straightforward. If traders choose to proceed, they should safeguard their positions against any unexpected rebound over the SMA trend line points. In the long run, the crucial support level is around $1.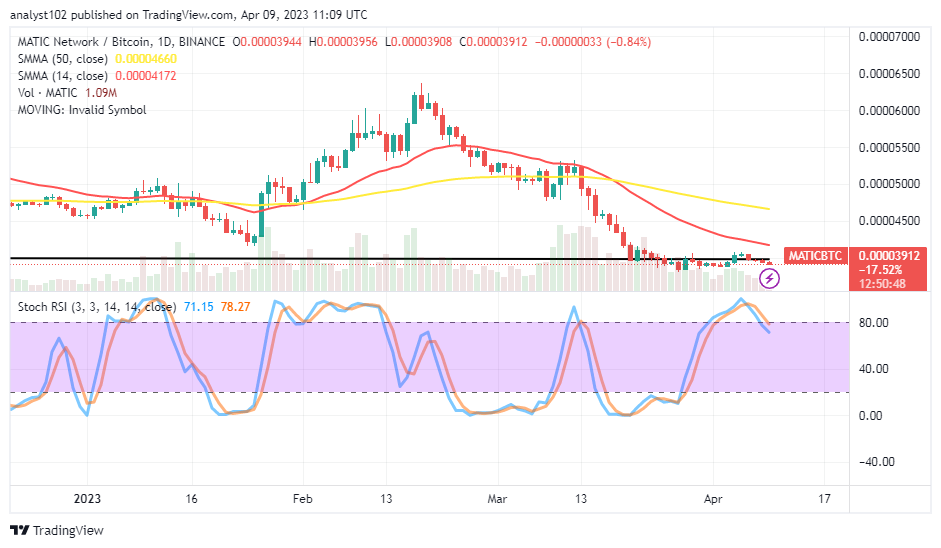
MATIC/BTC Price Analysis
In contrast, Polygon is showcased by the Stochastic as still being on the verge of losing stances against Bitcoin. A line of trading candlesticks signals the pairing cryptocurrency market keeps a low-bearish trend beneath the SMA trend lines. The 14-day SMA indicator is under the 50-day SMA indicator. The Stochastic Oscillators have crossed southbound from the overbought region to 78.27 and 71.15 levels. That suggests that the foundational cryptocurrency is taking its time to establish a baseline that might not materialize soon.
Note: Cryptosignals.org is not a financial advisor. Do your research before investing your funds in any financial asset or presented product or event. We are not responsible for your investing results.
You can purchase Lucky Block here. Buy LBLOCK